Table 1.
Basal and stimulated NO production, iNOS content and phenotype CD markers in macrophages isolated from highly tumor-resistant C57BL/6N substrain and lowly tumor-resistant C57BL/6J substrain.
| Substrain | Survival after tumor induction, days | Indices of NO generation system | M1 marker, CD 80 | M2 marker, CD206 | |
|---|---|---|---|---|---|
| C57BL/6N | 19.5+0.5 | Nitrite, μmol | 80.6±5.6% | 52.7±4.9% | |
| Basal conditions | Stimulated conditions | ||||
| 45.7±1.34 | 74.4±1.26 | ||||
| iNOS | |||||
| Basal conditions | Stimulated conditions | ||||

|

|
||||
| C57BL/6J | 15.6±0.6** | Nitrite, μmol | 4.0±0.3%** | 58.8±4.7% | |
| Basal conditions | Stimulated conditions | ||||
| 29.6±1.43** | 52.2±1.28** | ||||
| iNOS | |||||
| Basal conditions | Stimulated conditions | ||||

|

|
||||
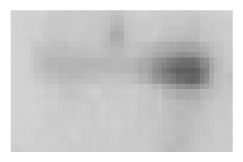
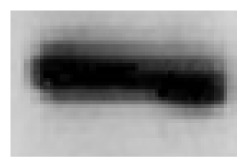
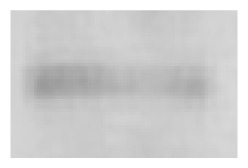
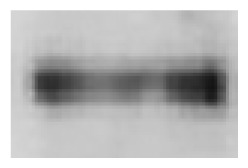
Immunograms of Western blot analysis are presented as inserts in the table; intensity of the black line reflects iNOS content in macrophages.
Significant difference between mouse substrains, p<0.01.
