Figure 2.

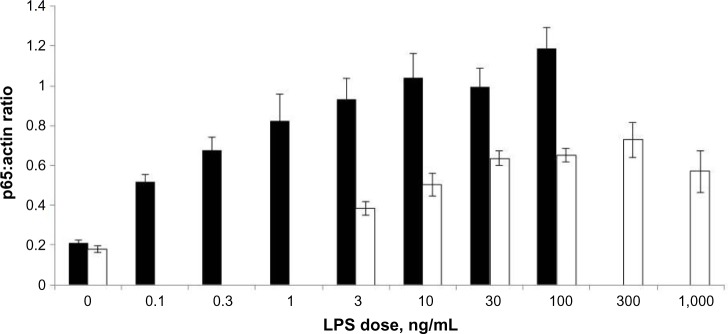
Results of densitometry on developed films of immunoblots of nuclear extract from ThP-1 cells (black) and RaW 264.7 (white) dosed with varying increasing concentrations of lPs (n=3).
Notes: Bar charts are displayed with P65:actin ratio mean on the Y-axis and lPs dose (ng/ml) on the X-axis. Means are plotted with standard error of the means. Experiments were repeated three times (n=3).
Abbreviation: lPs, lipopolysaccharide.
