Figure 4.

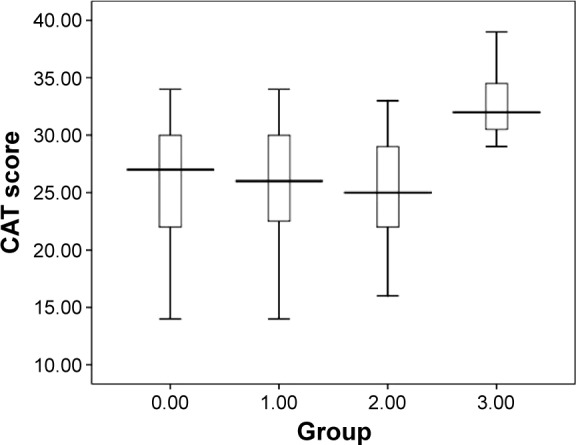
Statistical distribution (box plot) of CAT scores according to the four respiratory infectious phenotypes: 0 – non-infectious group, 1 – viral infection, 2 – bacterial infection, 3 – coinfection.
Abbreviation: CAT, COPD Assessment Test.

Statistical distribution (box plot) of CAT scores according to the four respiratory infectious phenotypes: 0 – non-infectious group, 1 – viral infection, 2 – bacterial infection, 3 – coinfection.
Abbreviation: CAT, COPD Assessment Test.