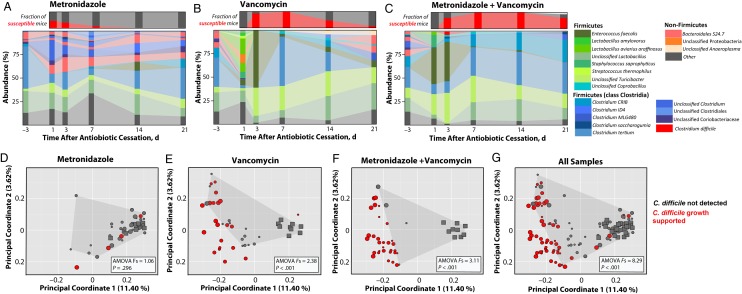
Figure 5.
Antibiotic-induced disruptions of microbial communities contribute to Clostridium difficile susceptibility. A–C, Colon samples were collected from mice 24 hours after C. difficile infection and assessed for abundance of individual bacterial operational taxonomic units (large panels). Each stacked bar represents mean microbiota composition of 3 independently housed mice from cohort 1. Small panels in A–C represent the fraction of mice found susceptible to C. difficile 24 hours after infection in all cohorts (red bar; n = 9 mice per time point). D–G, Principal coordinate analysis of colon samples from all cohorts 24 hours after infection. Squares represent preantibiotic samples; circles, postantibiotic treatment samples. Circle sizes represent the time point of each posttreatment sample, with large circles representing earliest time points. Analysis of molecular variance (AMOVA) F statistics were used to compare samples in which C. difficile was not detected (gray points bounded by shaded region) with samples that supported C. difficile growth (red points).

