Figure 1.
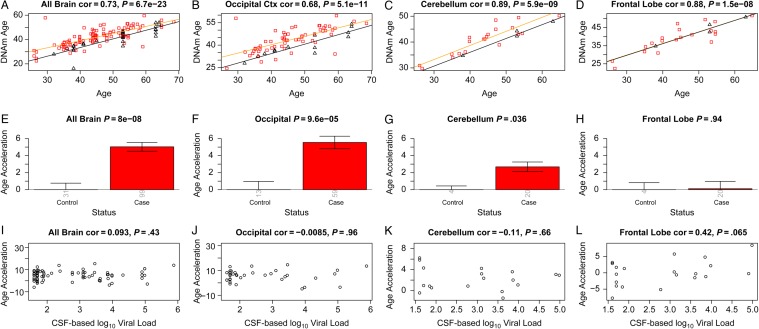
Discovery brain data from human immunodeficiency virus (HIV)–infected subjects (cases) and HIV-uninfected subjects (controls). A–D, DNA methylation (DNAm) age versus chronological age in all brain samples (A) and occipital cortex (B), cerebellum (C), and frontal lobe (D) samples. Red squares and black triangles in the scatterplot denote samples from cases and controls, respectively. The orange line depicts a linear regression line through case samples. Similarly, the black solid line corresponds to a regression line of DNAm age on chronological age in control samples. For each subject (point), age acceleration is defined as the vertical distance to the black regression line (ie, DNAm age minus the expected value based on control samples). E, Mean age acceleration versus control status in all brain samples. Each bar plot depicts 1 standard error around the mean value and reports the Kruskal–Wallis (nonparametric) group comparison test P value. Analogous results can be obtained when restricting the analysis to occipital cortex (B and F) or cerebellar (C and G) samples but not for samples from the frontal lobe (D and G). E–H, The group comparisons in panels E–H involved a total of 130, 72, 24, and 24, samples respectively. The number of samples in each group is reported by the rotated number under each bar. I–L, HIV load (log10 transformed) in cerebrospinal fluid (CSF) of cases versus age acceleration in all brain samples (I) and occipital cortex (J), cerebellum (K), and frontal lobe (L) samples. Abbreviation: cor, correlation.

