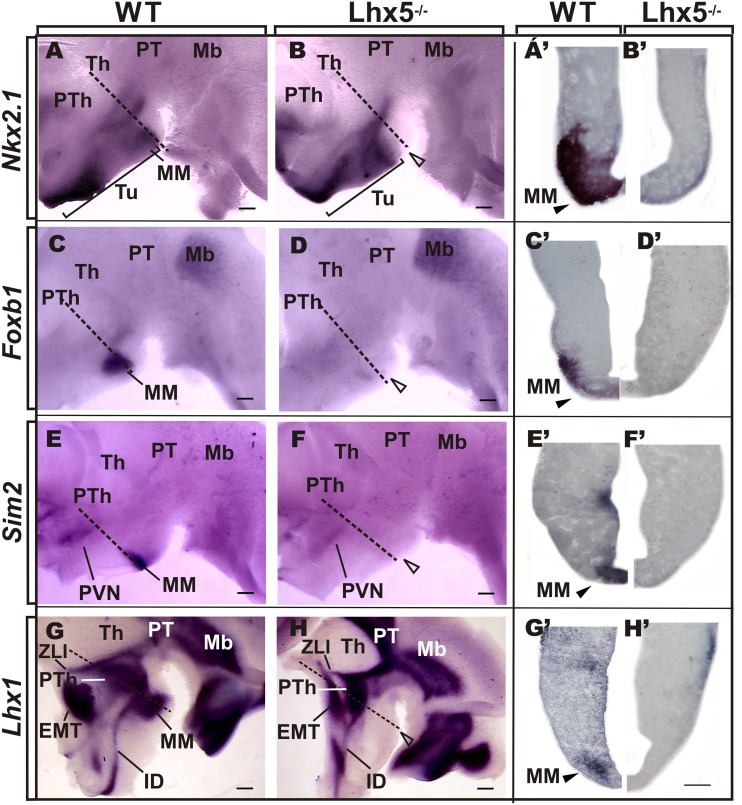
FIGURE 3.
Comparative analysis of MM markers in the developing embryo. Genetic expression profile of Nkx2.1, Foxb1, Sim2, and Lhx1 in the prospective MM in E12.5 preparations of whole-mount (A–H, anterior is to the left) and coronal sections (A’–H’) of corresponding Lhx5 mutant and control embryos, as indicated. Empty arrowheads point to the approximate location of MM in Lhx5 mutants. Dashed lines in (A–H) indicate the approximate plane of sections shown in (A’–H’). Brackets in (A,B) demarcate the extent of Nkx2.1 expression along the anterio-posterior axis. Abbreviations: Th, thalamus; EMT, eminentia thalami; IDv, ventral intrahypothalamic diagonal; Mb, midbrain; MM, mamillary; PVN, paraventricular nucleus; PT, pretectum; PTh, prethalamus; Tu, tuberal; ZLI, zona limitans intrathalamica. Scale bars: (A–H) 400 μm, (A’–H’) 200 μm.

