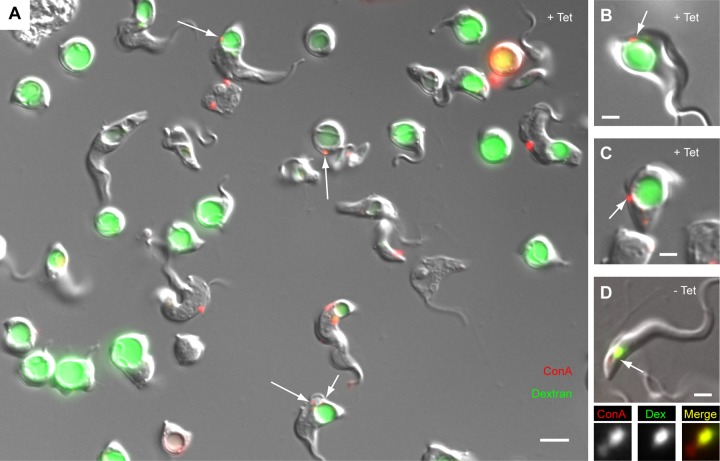
FIG 6.
Loss of overlap between dextran (20-Å diameter) and ConA (80-Å diameter) in unfixed TbMORN1-depleted cells. TbMORN1 RNAi cells from uninduced or induced (14-h point) populations were incubated simultaneously with fluorophore-conjugated ConA (red) and dextran (green) for 30 min at 37°C and analyzed directly. Immunofluorescence images are shown superimposed on DIC images. (A) Representative field of view from a population of TbMORN1-depleted cells. The labeling patterns recapitulate those seen in fixed cells. Dextran was found inside the enlarged FP. The ConA signal could frequently be observed in punctate accumulations (arrows) as seen in fixed cells. Scale bar, 5 μm. (B and C) Two more examples from the induced population. The ConA accumulation (arrow) matches that seen in fixed cells. (D) A cell from the uninduced population. Both labels show a good degree of overlap. The labeled area indicated with the arrow is shown in the insets below. Scale bars: 5 μm (A) and 2 μm (B to D).

