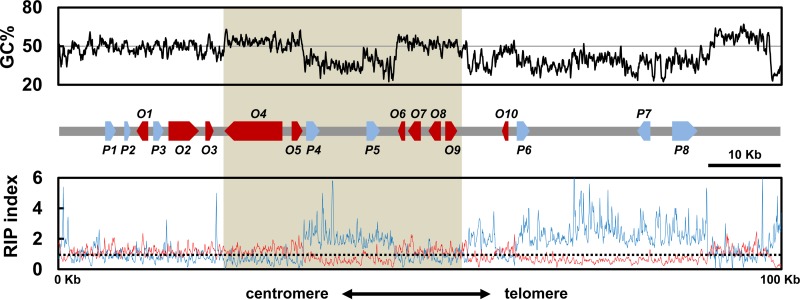
FIG 1.
Solanapyrone biosynthesis gene cluster and its genomic environment. Sliding-window analysis of the nucleotide composition was conducted with the chromosome end harboring the genes of the solanapyrone biosynthesis gene cluster. The GC content (in percent; top, black line), RIP index I (number of ApT residues/number of TpA residues; bottom, blue line), and RIP index II [(number of CpA residues + number of TpG residues)/(number of ApC residues + number of GpT residues; bottom, red line] were calculated in a 200-bp window, which was slid in 50-bp increments across the terminal 100 kb from the telomere end. The x axis shows the distance from the left edge of the window. The (TTAGGG)9 telomere repeats were found in the rightmost region. A schematic diagram of the arrangement and orientation of open reading frames (O1 to O10; red arrows) and pseudogenes (P1 to P8; blue arrows) is shown in the middle. The shaded area indicates the region harboring the solanapyrone cluster genes (sol1 to sol6). The relative positions and details of the gene content in the 100-kb region are listed in Table 1. The horizontal solid line in the top panel shows the 50% GC mark, while the dashed line in the bottom panel shows a RIP index value of 1.

