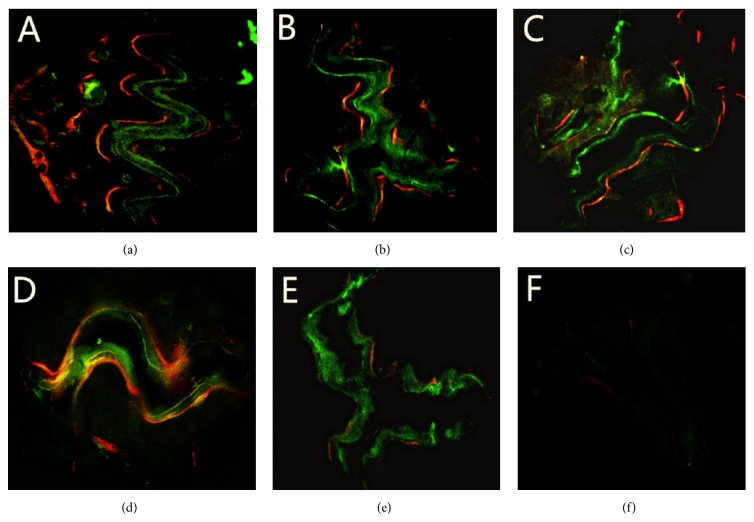
Figure 2.
The images of sequential fluorescent labeling at 4 weeks. (a) nHA/CS/PLGA scaffolds + hUCMSCs; (b) nHA/PLGA scaffolds + hUCMSCs; (c) CS/PLGA scaffolds + hUCMSCs; (d) PLGA scaffolds + hUCMSCs; (e) nHA/CS/PLGA scaffolds without seeding; (f) the control group (no scaffolds). The fluorescent labeling was visible around and inside the defects and the fluorescence-labeled areas were more extensive compared with the other groups (p < 0.01) (a). Only weak fluorescence signals were found around the defects (f). Original magnification: 50x.

