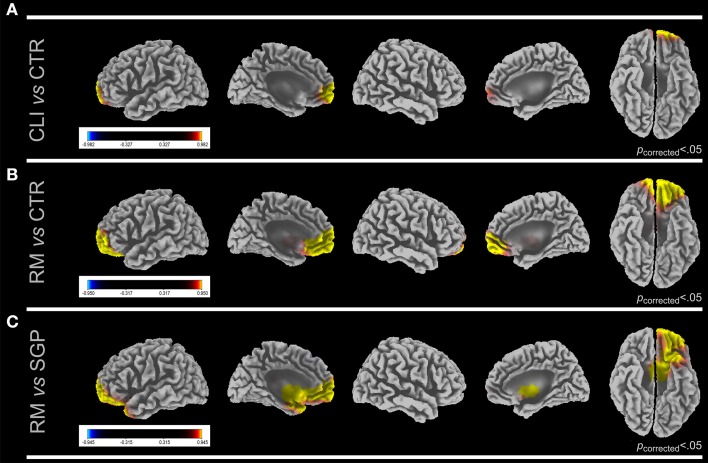
Figure 1.
LORETA images show cortical activation differences in gamma band at first session (T0) between CLI vs. CTR (A), RM vs. CTR (B), and RM vs. SGP, (C). Five views of the brain (lateral and medial left hemisphere, lateral and medial right hemisphere and ventral view) are shown for each comparison. Significant F-values (Bonferroni corrected) are reported. F-values colored scale is also shown for each comparison. Yellow, first group > second group; blue, second group > first group. CLI, All Clients; RM, Rome Clients; SGP, San Giuliano di Puglia Clients.

