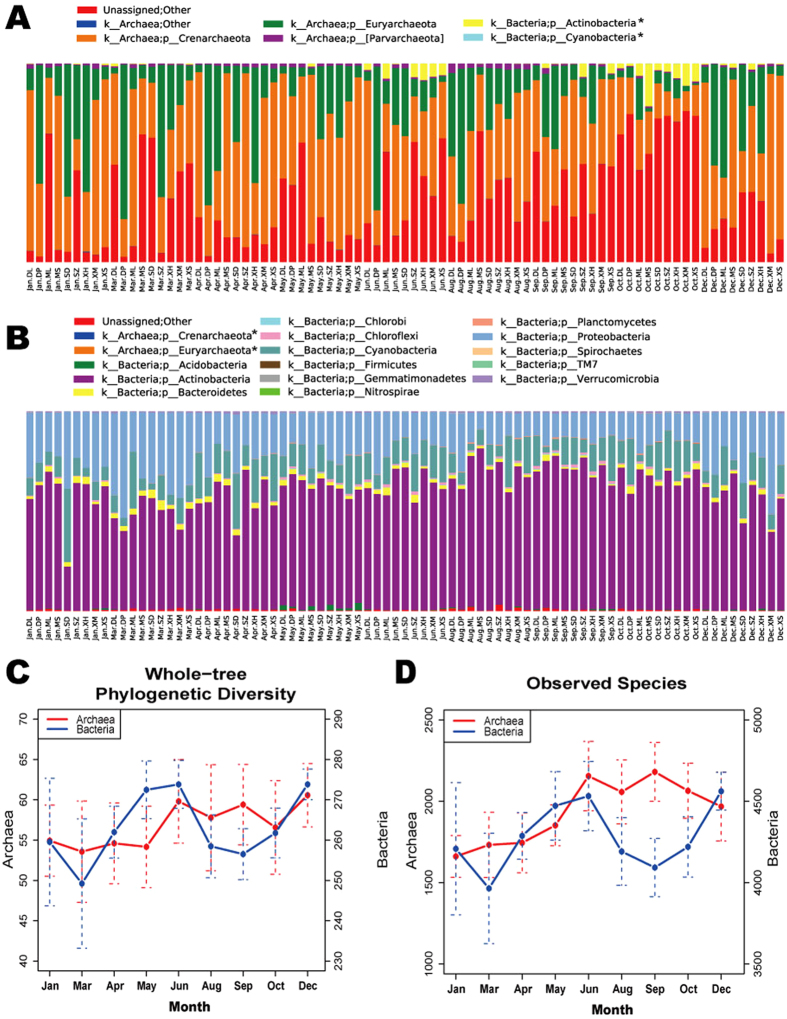
Figure 2. Phylum-level microbial community profile and species richness of archaea and bacteria.
(A,B) represent the relative abundances of bacterial and archaeal phyla in the 81 samples, respectively. Sample IDs are composed of the sampling month and site name. Bar colors represent different phyla, and bar lengths represent the relative abundances. The bacteria and archaea phyla marked with “*” include taxonomies that have highly similar 16S rRNA sequences and are not distinguishable by the PCR primer. (C,D) show temporal variations of archaeal and bacterial richness within samples, measured with two metrics, whole-tree phylogenetic diversity and observed species, respectively. Sequencing data were firstly resampled to the same sequencing depth for all samples. The left y-axis and right y-axis are for archaeal and bacterial curves, respectively.

