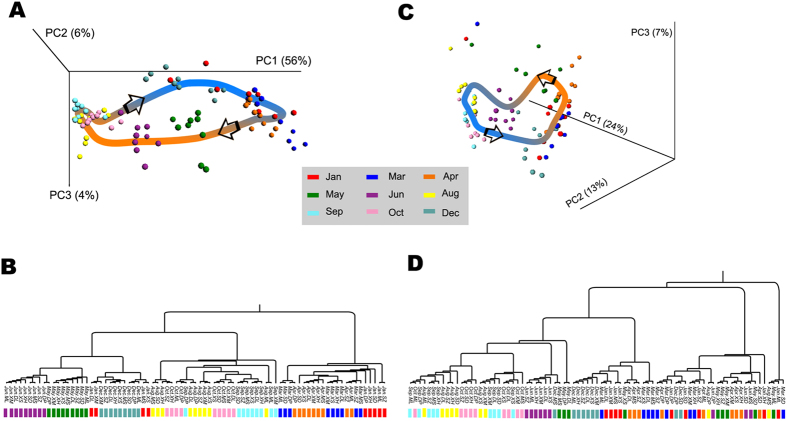
Figure 4. PCoA and UPGMA on bacterial community showing significant clustering correlated with temporal variations.
(A) PCoA result based on OTU relative abundances of samples using unweighted Unifrac metric. Temporal variation is the main factor contributing to the community variation. Additionally, samples from January to December are distributed in a circled pattern, which implies an annual cycle of the temporal variation of microbial community. (B) UPGMA result based on the unweighted Unifrac metric used in PCoA. The hierarchical clustering structure helps to determine the similarity of the microbial communities between different months. Consequently, we group samples into four stages that are correlated with four seasons in a year.

