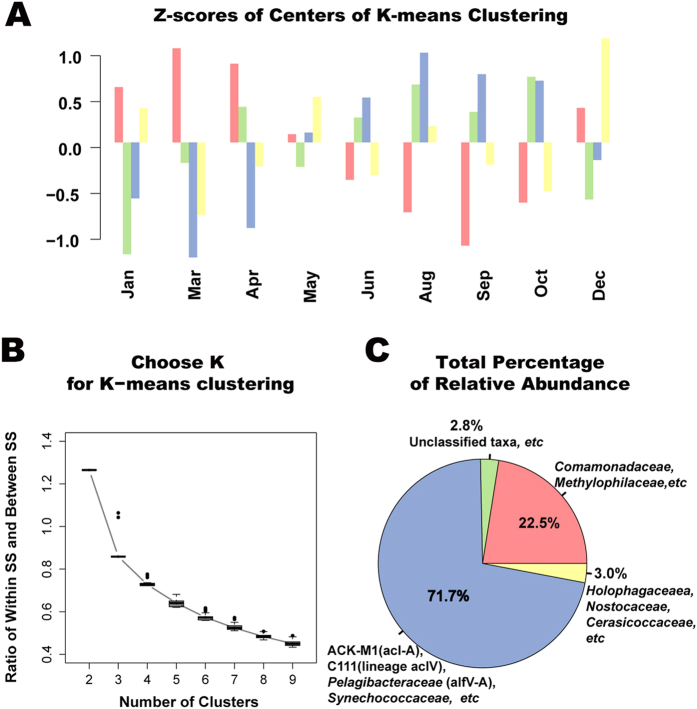
Figure 5. K-means clustering results identifying synchrony of different genera.
Relative abundance of genera was firstly transformed into Z-scores as described in Materials and Methods. Then, synchronized genera defined as genera that have similar temporal variations were identified by K-means clustering. (A) Relative abundances of “center” genera of resulted clusters at different sampling months. (B) The ratio of within-cluster SS and between-cluster SS as function of the number of clusters. This curve helps to determine the appropriate parameter K in K-means clustering. (C) Total abundance of each cluster and corresponding representation phylum. Phylum assignments of most abundant genera that take up >50% of cluster abundances were used to represent each cluster.

