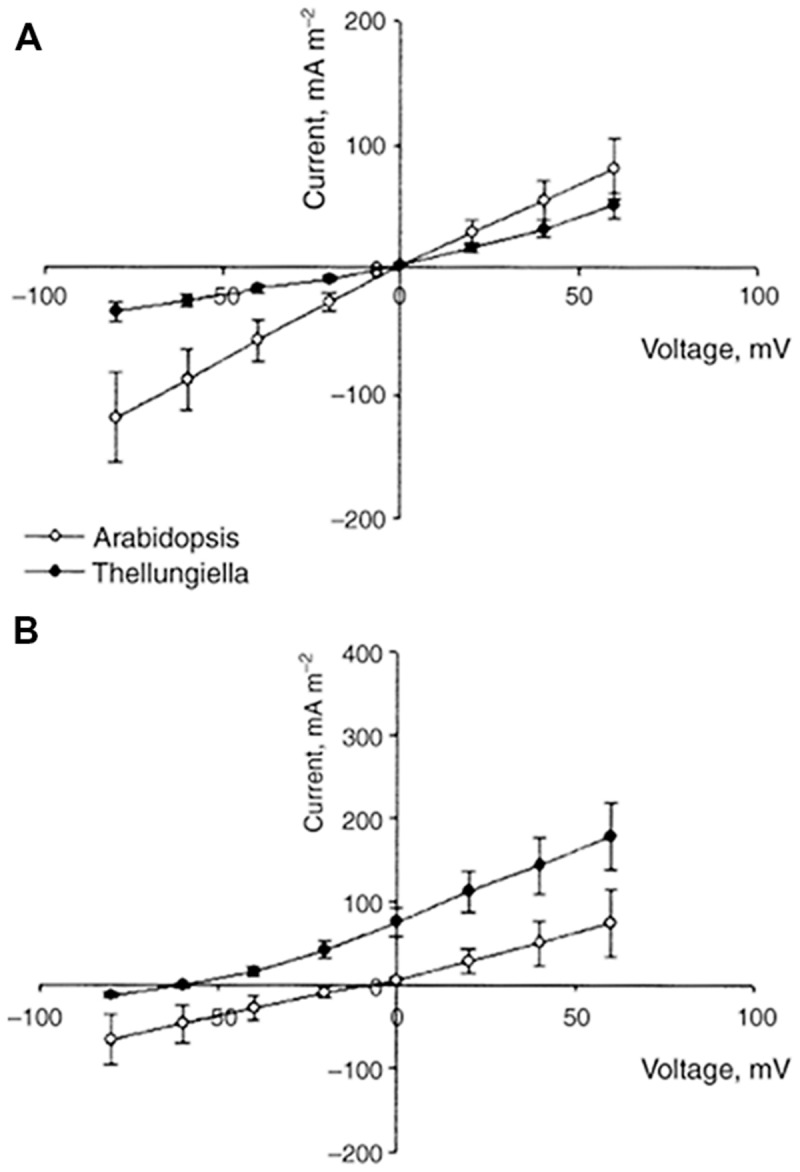
FIGURE 4.

Comparison of current–voltage curves for whole-cell instantaneous currents in root protoplasts of A. thaliana (open symbols) and T. halophila (closed symbols). Currents are normalized to protoplast surface. The pipette solution was always 100 mM KCl. The bath solution was 100 KCl (A) or 100 NaCl (B). Data are given as means ± SE (n = 6 for A. thaliana, n = 13 for T. halophila). Reproduced from Volkov and Amtmann (2006) with the permission from the publisher John Wiley and Sons. Note that IV curve for instantaneous current in T. halophila resembles (though not completely obeys) the expected one from Goldmann–Hodkin–Katz equation and the shift in reversal potential of ion current in 100 mM KCl/100 mM NaCl is reflected in slope of IV curve for voltages above and below the reversal potential. The electric current characterizes the ion transport properties of plasma membranes and their selectivity for K+ over Na+.
