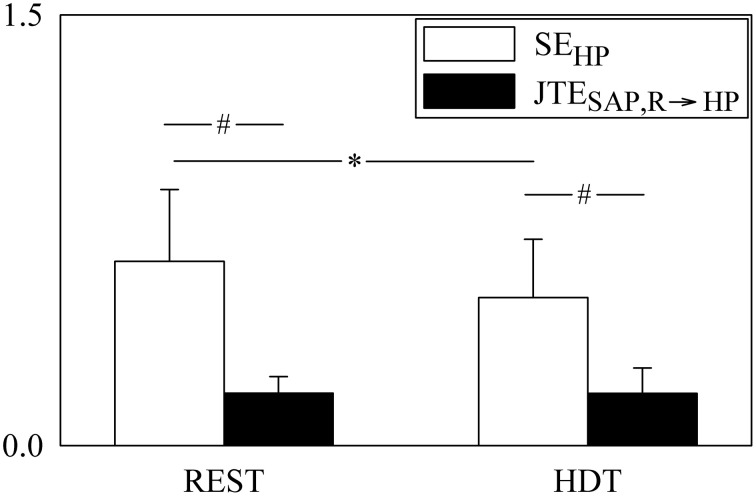
Figure 3.
The grouped bargraph shows the SEHP (white bars) and JTESAP, R → HP (black bars) assessed at REST and during HDT. SEHP and JTESAP, R → HP are the two terms of the PEHP decomposition according to Equation (20). The values are reported as mean plus standard deviation. The symbol * indicates a significant difference between experimental conditions within the same index, while the symbol # indicates a significant difference between indexes within the same experimental condition with p < 0.05.

