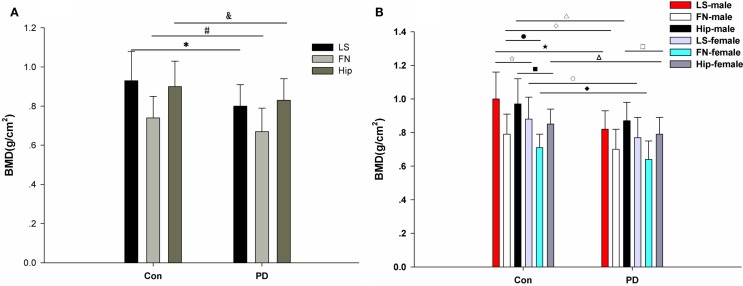
Figure 2.
BMD in PD patients and healthy controls. (A) Comparison of BMD in the lumbar spine (LS), femoral neck (FN), and hip between the matched control group and the PD group. There are significant differences in LS, FN, and hip BMD between the PD patients and the controls. *LS: PD vs. control: 0.80 ± 0.11 vs. 0.93 ± 0.15, ***p < 0.001; #FN: PD vs. control: 0.67 ± 0.12 vs. 0.74 ± 0.11, **p = 0.002; and hip: PD vs. control: 0.83 ± 0.11 vs. 0.90 ± 0.13, **p = 0.004. (B) Comparison of BMD in the lumbar spine (LS), femoral neck (FN), and hip between the matched control group and the PD group, which were divided into gender-specific groups. There are significant differences in LS BMD between the control males and the control females (□: 1.00 ± 0.16 vs. 0.88 ± 0.13, **p = 0.005), the PD males and the control males (□: 0.82 ± 0.11 vs. 1.00 ± 0.16, ***p < 0.001), and the PD females and the control females (○: 0.77 ± 0.12 vs.0.88 ± 0.13, **p = 0.002). There are significant differences in FN BMD between the control males and the control females (●: 0.79 ± 0.12 vs. 0.71 ± 0.08, **p = 0.003), the PD males and the control males (□: 0.70 ± 0.12 vs. 0.79 ± 0.12, **p = 0.008), and the PD females and control females (□: 0.64 ± 0.11 vs. 0.71 ± 0.08, *p = 0.012). There are significant differences in hip BMD between the PD males and PD females (□: 0.87 ± 0.11 vs. 0.79 ± 0.10, **p = 0.007), the control males and the control females (□: 0.97 ± 0.15 vs. 0.85 ± 0.09, **p = 0.001), the PD males and the control males (Δ: 0.87 ± 0.11 vs. 0.97 ± 0.15, **p = 0.007), and the PD females and the control females (∆: 0.79 ± 0.10 vs. 0.85 ± 0.09, **p = 0.009).

