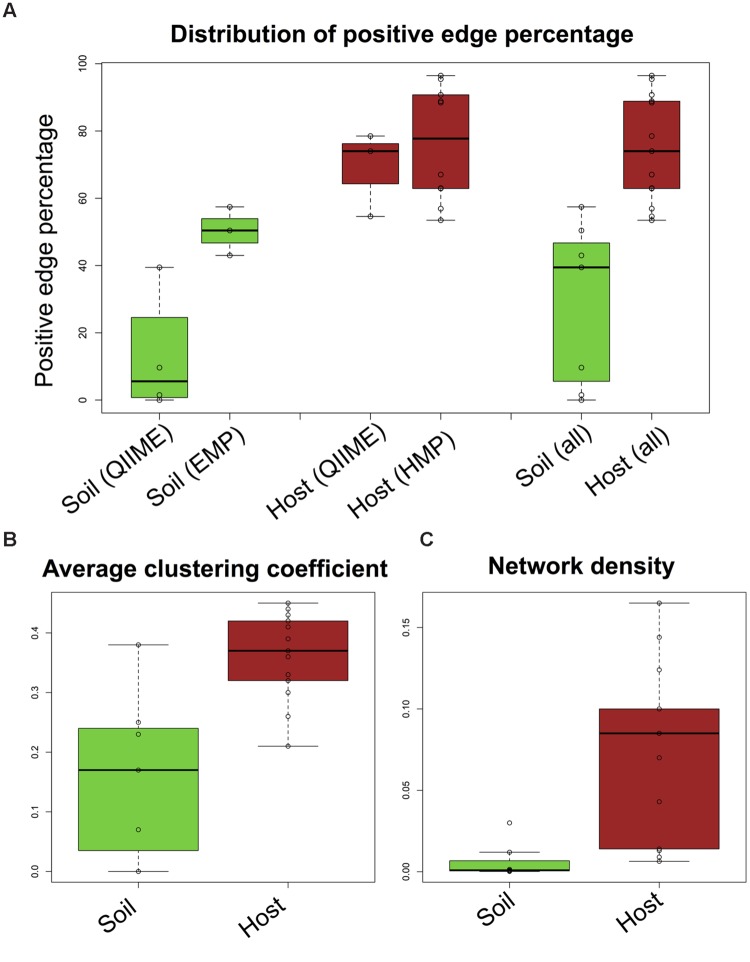
FIGURE 2.
Differences between host and soil networks. Soil networks fall into two groups, characterized by low (QIIME soils) and high sequencing depth [Earth Microbiome Project (EMP) soils], whereas host networks constructed from QIIME and Human Microbiome Project (HMP) samples have comparable PEP. When taking all networks together, PEP in soil is significantly lower (p-value: 0.0002 according to the Wilcoxon rank sum test) than in host (A). The average clustering coefficient (B) and network density (C) are also significantly different (p-values: 0.004 and 0.002, Wilcoxon rank sum test). Network density is computed as 2E/N(N-1), where E is the edge number and N the number of taxa in the processed matrix.

