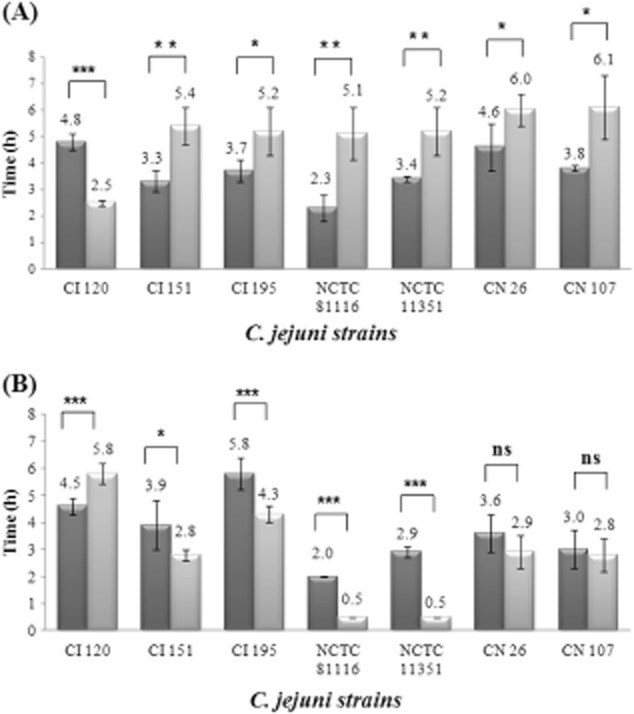
Figure 2.

Induction of an adaptive tolerance response in different C. jejuni strains. Average values of the time (h) taken for the survivors to reach 0.1% of the initial population [tS(0.1%)] are shown with standard deviation as error bars (n = 6).A. Results of challenged cells in mid-exponential phase.B. Results of challenged cells in early stationary phase. Dark gray columns: unadapted cells, light gray columns: challenged cells.***Extremely significant difference (P < 0.001).**Very significant difference (P < 0.01).*Significant difference (P < 0.05).ns: Not significant difference (P > 0.05).
