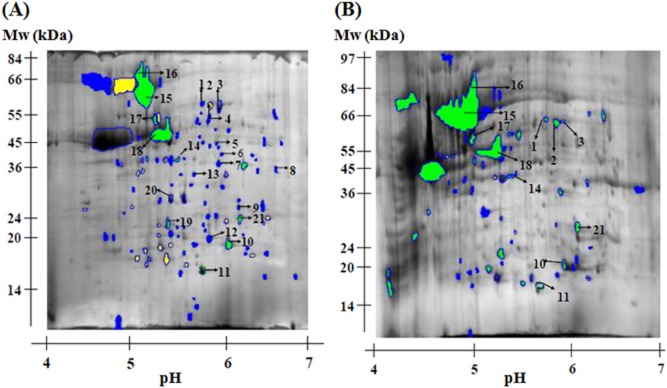
Figure 3.

A. Image analysis of an average of triplicates C. jejuni CI 120 proteins from early stationary phase adapted cells which were compared with triplicates C. jejuni CI 120 proteins from early stationary phase control cells, normalized using spot number 11 (Chew protein). Proteins 1–21 were identified using MALDI-TOF mass spectrometry (see Table 1). B. Image analysis of an average of triplicates C. jejuni CN 107 proteins from early stationary phase adapted cells which were compared with triplicates C. jejuni CN 107 proteins from early stationary phase control cells and normalized using spot number 11. Arrowed spots had similar molecular mass and pI to the same numbered spots in gel shown in 3A, identified using MALDI-TOF mass spectrometry (see Table 1). Colour coding: proteins detected only after ATR (blue), upregulated proteins (green), downregulated proteins (yellow) and unchanged proteins (blue open circle).
