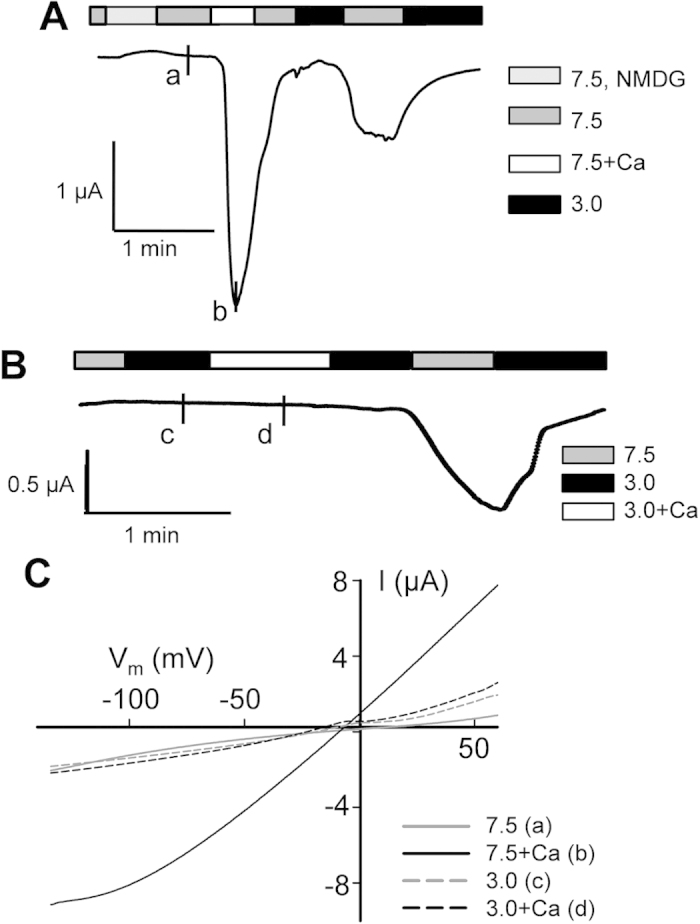
Figure 5. Acid-induced vs Ca2+-induced channel activation of PKD2L1.

(A) Representative current recorded at −50 mV in a PKD2L1-expressing oocyte to show the on-response induced by 5 mM extracellular Ca2+ (at pH 7.5) and the subsequent off-response induced by extracellular pH 3.0 (no extracellular Ca2+). (B) Representative current recorded at −50 mV in a PKD2L1-expressing oocyte to show the on-response induced by 5 mM extracellular Ca2+ (at pH 3.0) and the subsequent off-response induced by extracellular pH 3.0 (no extracellular Ca2+). (C) I–V curves generated at the time points (‘a’–‘d’) indicated in panels A and B.
