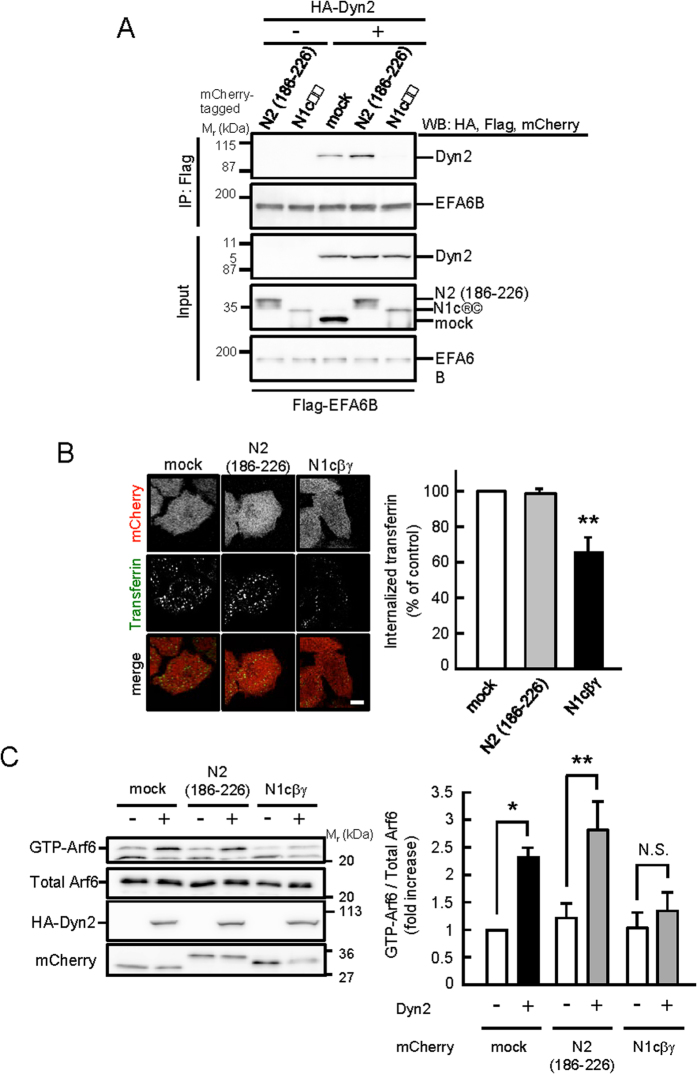
Figure 6. Involvement of Dyn2-EFA6B axis in transferrin uptake.
(A) Flag-EFA6B and cDNA for the binding site peptide (mCherry-N1cβγ) or non-binding peptide of EFA6B (mCherry-N2 (186–226)) were coexpressed with HA-Dyn2 in HEK293T cells. After 48 hr of expression, peptides of EFA6B were immunoprecipitated with anti-Flag antibody beads, and coimmunoprecipitated Dyn2 was assessed by western blotting probed with anti-HA antibody. (B) HeLa cells transfected with mCherry-N1cβγ or mCherry-N2 (186–226) were cultured for 24 hr. After starvation for 30 min, cells were incubated with Alexa488-conjugated human transferrin at 37 °C for 10 min. The fluorescent intensity of internalized transferrin was measured as described in Methods. Right panels represent the mean ± SEM of percentages of internalized transferrin from three independent experiments. Statistical significance was calculated using Tukey multiple comparison test; **P < 0.01. Scale bar, 10 μm. (C) mCherry-N1cβγ or mCherry-N2 (186–226) was coexpressed with Arf6-Flag and with or without HA-Dyn2 in HEK293T cells. After 48 to 72 hr of expression, the levels of GTP-Arf6 were detected as in Fig. 1A (left panels). Right panel represents the mean ± SEM of the levels of GTP-Arf6 from six independent experiments. Statistical significance was calculated using Tukey multiple comparison test; *P < 0.05, **P < 0.01 and N.S., not significant.

