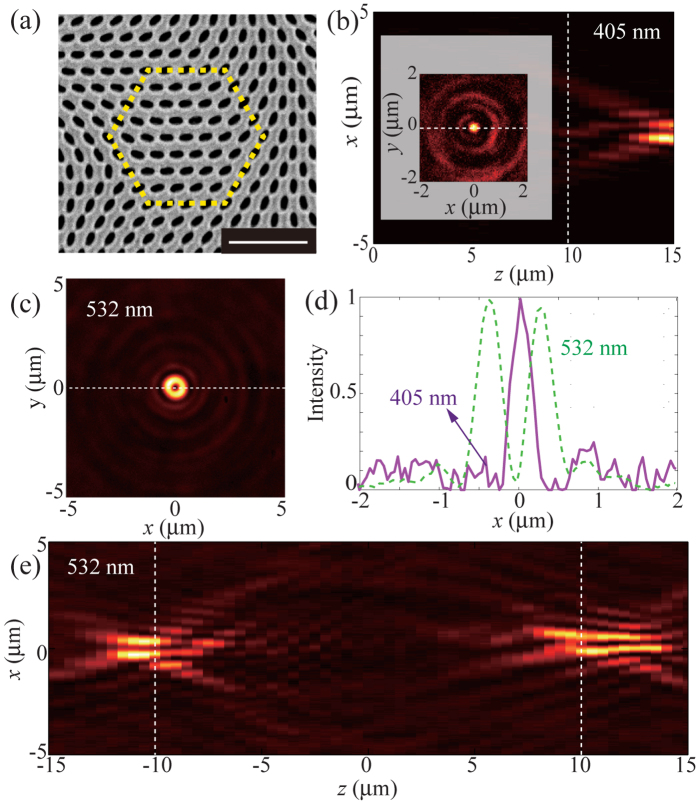
Figure 3. Measurement of the STED lens.
(a) SEM image of the sample, scale bar: 1 μm. (b) Measured intensity distribution in the xz-plane at λ = 405 nm. Inset shows the solid spot at z = 10 μm. (c) Measured cross-section of the vortex beam at z = 10 μm and λ = 532 nm. (d) Comparison of the intensity curves at z = 10 μm and y = 0 for λ = 532 and 405 nm. (e) Experimental intensity distribution in the xz-plane at λ = 532 nm for linear polarization incidence. There are symmetrical hollow spots on both sides at z = ±10 μm.

