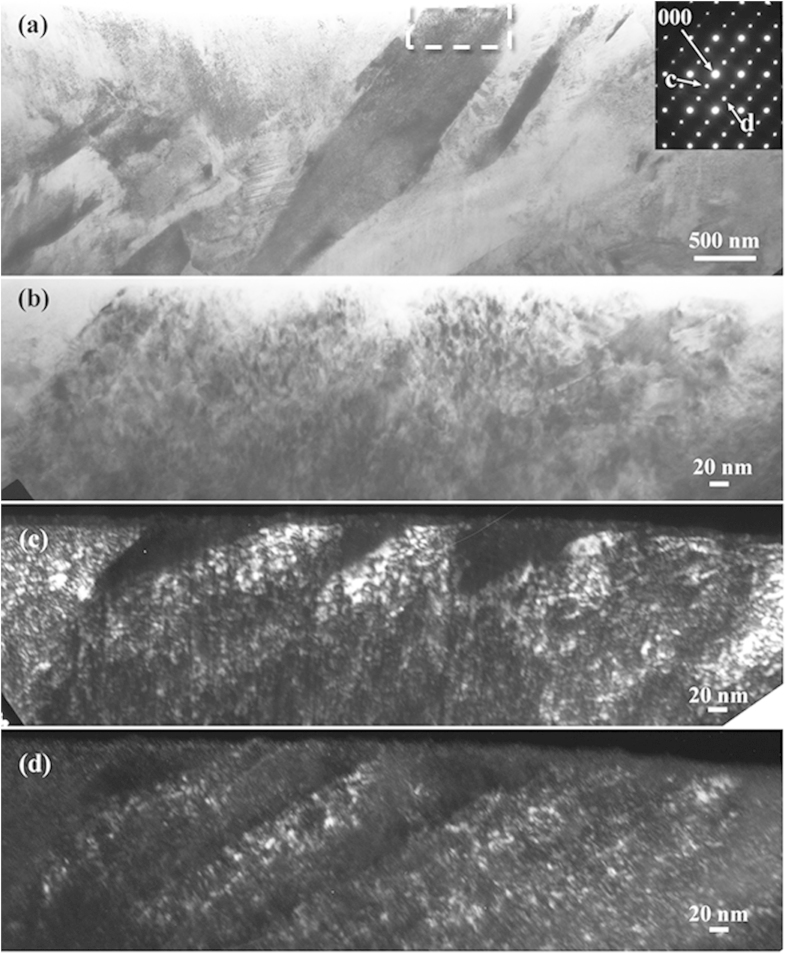
Figure 5. TEM observation results from the as-quenched Fe-0.98 mass% C sample.
(a) A typical bright-field image of plate martensite and the corresponding SAED pattern observed with the electron beam parallel to [011]bcc. (b) High magnification of the region outlined by the dashed rectangle in (a). (c,d) are dark-field images of the diffraction spots c and d in (a), respectively.

