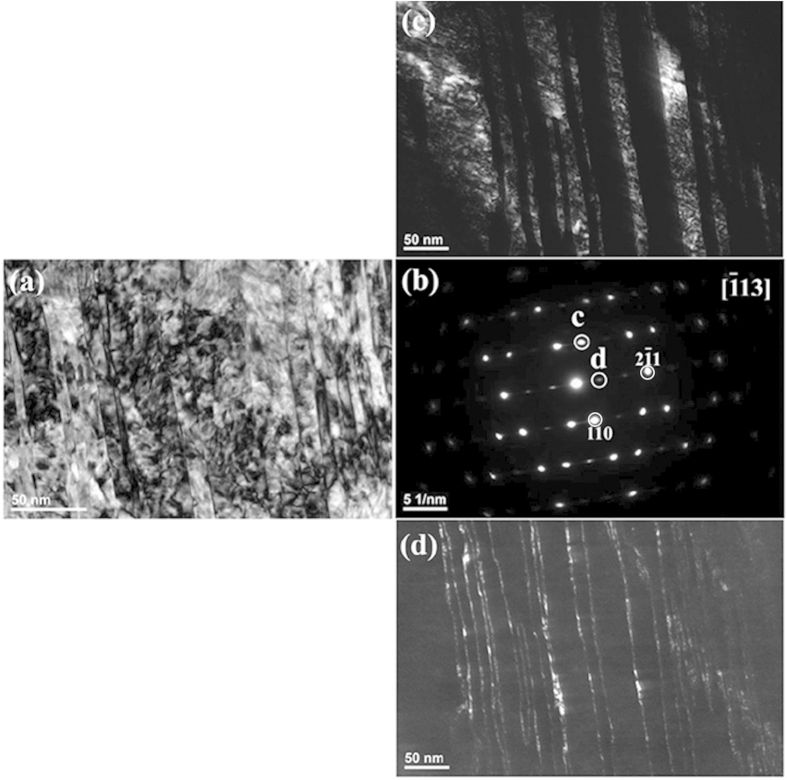
Figure 7. SAED patterns of [ ]α and the corresponding bright-field TEM images of the as-quenched Fe-0.58 mass% C sample.
(a) The bright-field image; (b) the SAED pattern from α-Fe with [ ]α as the zone axis. (c,d) are the dark-field images taken from the spots shown in (b) indicated by circles “c” and “d”, respectively.

