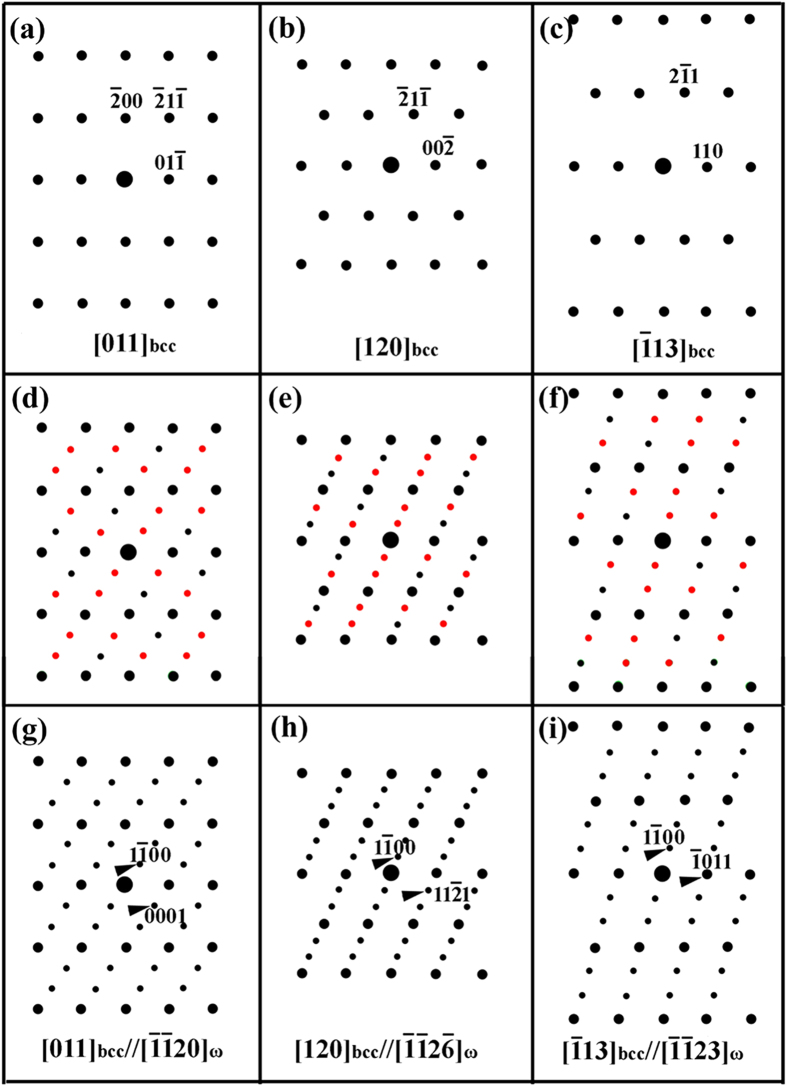
Figure 8. Schematic illustrations of the electron diffraction patterns with the electron beam parallel to the (a) [011], (b) [120] and (c) [ ] zone axes of a bcc single crystal observed on TEM.
In (d–f), there are extra sets of diffraction spots in addition to the diffraction spots from the bcc crystal. The small black spots, including those overlapped with the larger black spots from the bcc crystal, have a {112}<111>-type twinning relationship in the bcc crystals. Other small extra spots in red (colour online) were conventionally understood to be double-diffraction spots between matrix and twin. (g–i) are rebuilt by using ω phase parameter, where the diffraction spots are exactly the same as in (d–f).

