
Figure 3. Expression of IL6 and TGFB2 in TaMs induced by conditioned medium from PC cells 22Rv1 (22Rv1-TaM), VCaP (VCaP-TaM) and LnCAP (LnCaP-TaM), or CRC cells Sw480 (Sw480-TaM), Caco2 (Caco2-TaM) and HKE3 (HKE3-TaM).
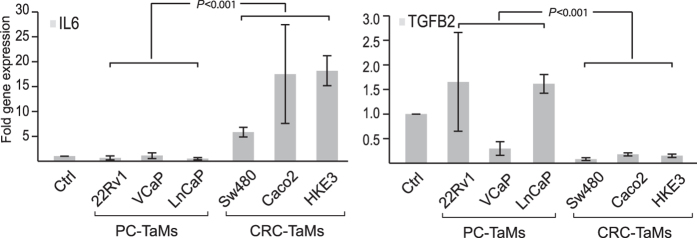
Shown is the fold gene expression from three or more independent experiments ± SD, with Ctrl macrophages set as 1. P-values for comparisons between TaMs induced by PC and CRC cell lines are indicated.