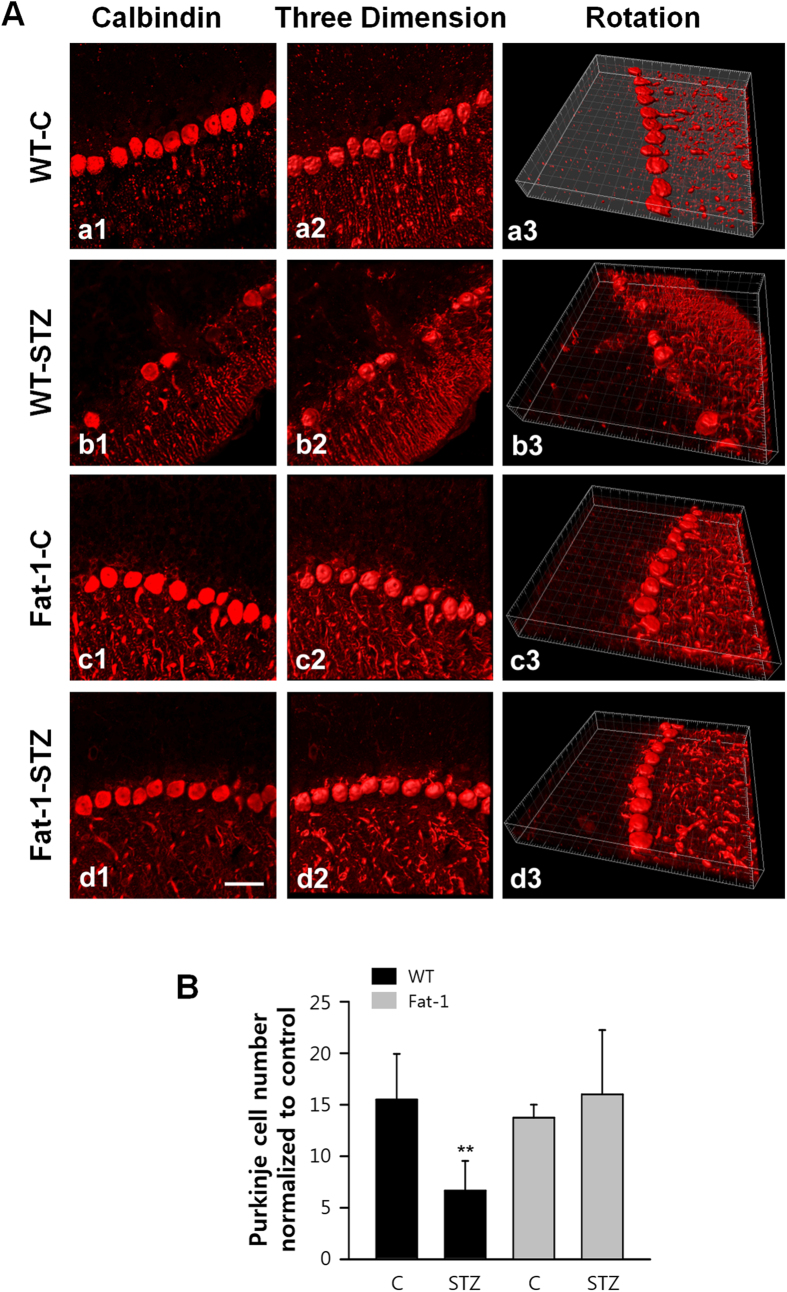
Figure 2. Fat-1 transgene protects animals from STZ-induced Purkinje cell loss.
(A) Representative confocal images showed the distribution of Calbindin immunoreactive cells by using 3D reconstruction in the cerebellar Purkinje cell layer of wild-type (a1-3, b1-3) and fat-1 transgenic mice (c1-3, d1-3), which obtained at day 18 after the fifth STZ injection. Scale bar = 10 μm. (B) Quantification of Purkinje cell loss of wild-type (n = 7/group) and fat-1 mice (n = 9/group) presented as number of Purkinje cells with same area. Differences were analyzed by the one-way ANOVA with post hoc Newman-Keuls test. ***P < 0.001, vs. control. Data present mean ± S.D.

