. 2015 Jul 30;17(35):22809–22814. doi: 10.1039/c5cp03550c

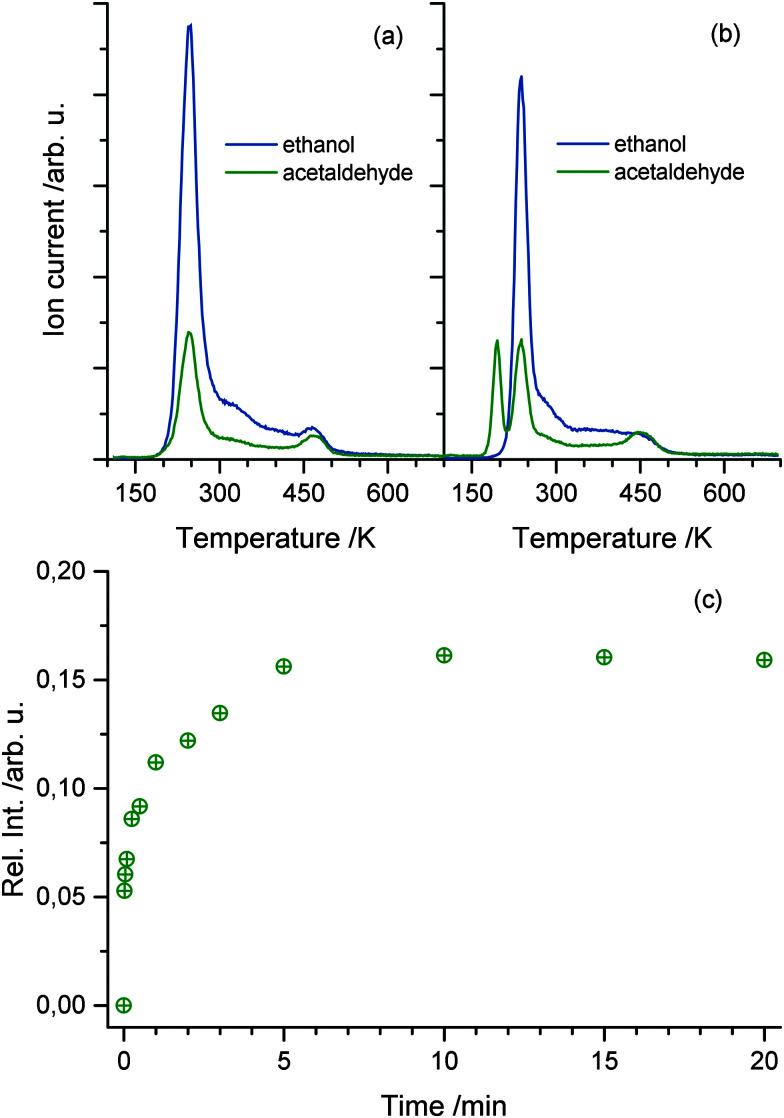
Fig. 2. (a) The thermal desorption mass signal of acetaldehyde and ethanol without photoexcitation. Note that the trace assigned to acetaldehyde is a fragment of either ethanol or acetaldehyde. Due to the constant ratio of both traces, the origin of the first peak is assigned to ethanol desorption, while acetaldehyde production only occurs at temperatures above 400 K. (b) The thermal desorption mass signal of acetaldehyde and ethanol after 10 min of UV excitation at 110 K. The consecutive TPD run shows another feature at 195 K, resulting from molecular acetaldehyde. (c) The integral over acetaldehyde production normalized to the overall ethanol dosage. The signal shows a rapid rise in acetaldehyde production within 1 s of photoexcitation and a saturation of acetaldehyde is found after 5 min of photoexcitation.

Fig. 2