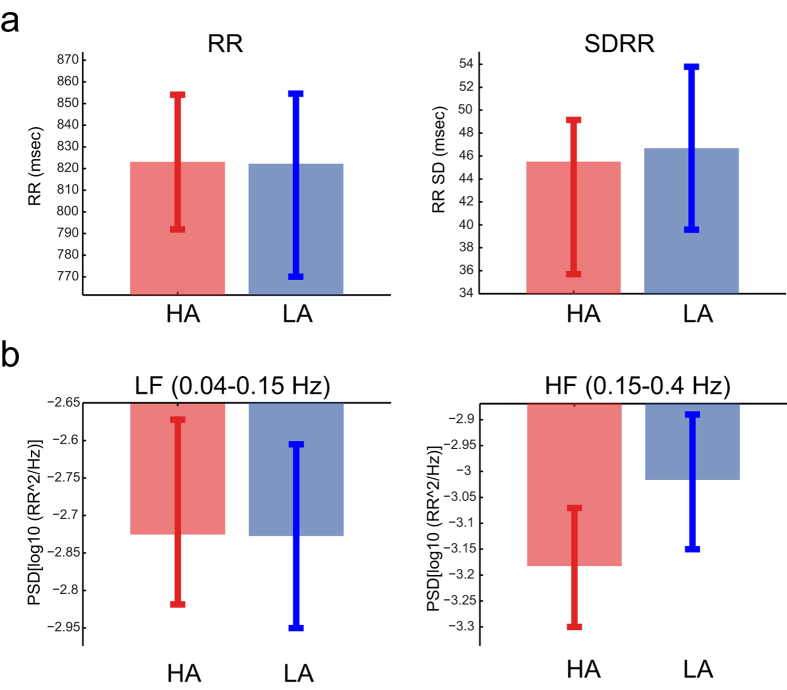
Figure 1. Heart rate variability during the high- (HA) and low-arousal (LA) conditions.
The analysed HRV indexes are: (a) Interbeat-intervals (RR); (b) Variability of the interbeat-intervals (RR) as expressed by their standard deviations (SDRR); (c) Power spectral density (PSD) of the RR intervals in the low- (LF) and high-frequency (HF or RSA). The whiskers represent +/−1 SEM.

