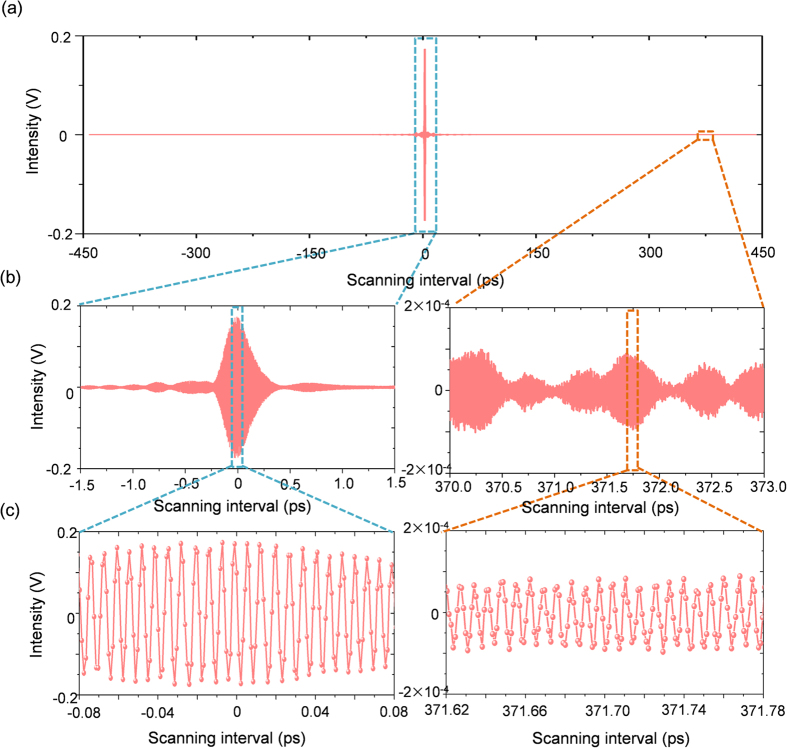
Figure 4. Interferogram measurement of the light source passing through the H13CN gas cell of 100-Torr pressure.
(a) Overall interferogram obtained during fr-sweeping under PLL stabilization to the Rb clock. (b) Magnified views (X300) at two different optical delays. (c) Magnified views (X6000) showing the sinusoidal carrier signal resolved inside the pulse envelope.

