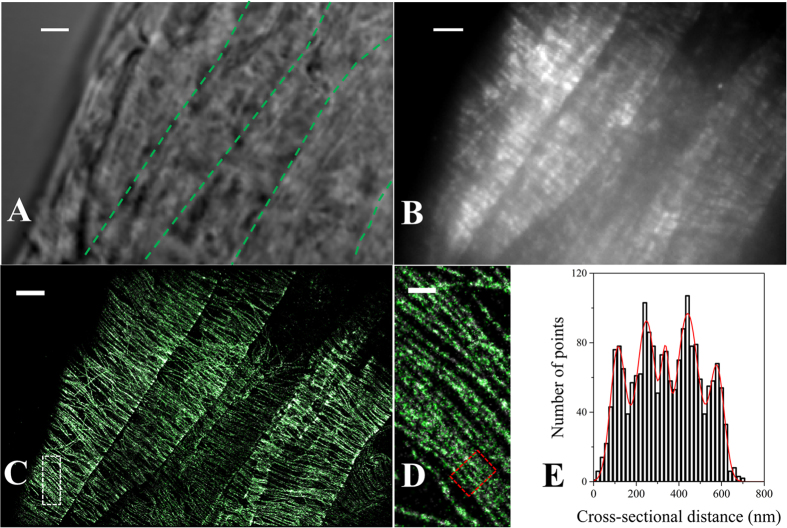
Figure 1. VAEM-STORM imaging of the cortical microtubule network of intact epidermal plant cells in the elongation zone of an Arabidopsis root tip.
(A) Bright field image of cells at the elongation zone. The cells shown here are also highlighted in Fig. 4A as region d. The boundary between cells is highlighted with green dashed lines in the bright field image. (B) Epi-fluorescence image of the dense cortical microtubule network in the elongating cells and (C) the corresponding STORM image. (D) Zoomed-in STORM image as indicated in the white region in (C). (E) Cross-sectional profiles of a microtubule bundle in the cell [highlighted in the red box in (D)]. The histogram shows the cross-sectional distribution of the positions within the region specified by the red box. The red line is the fitting result from five simple Gaussian functions showing the centers of individual microtubules that are 80.0 nm ~ 137.9 nm apart. Scale bar: 3 μm (A–C) and 500 nm (D).

