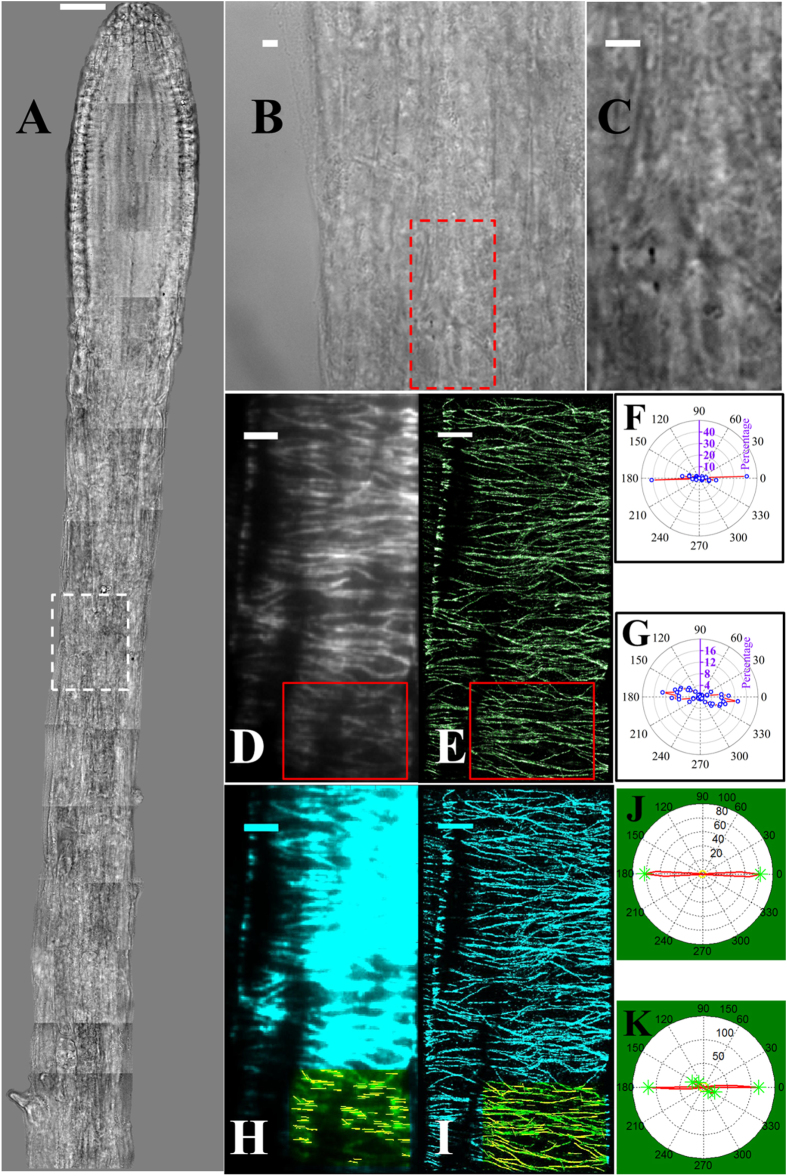
Figure 3. VAEM-STORM imaging of cortical microtubules in a plant epidermal cell of a whole intact root tip and orientation analysis.
Analysis was performed both manually and using Microfilament Analyzer (MFA) software. (A) Bright field image of the whole root tip. Image is a collage of individual images with the same optical setup (100× objective) as for epi-fluorescence and STORM imaging. The location of cells for STORM imaging in the whole root therefore can be easily determined from the bright field images under the same magnification. (B,C) Zoomed-in bright field images showing the location of cells used for STORM imaging. (D) VAEM image and (E) STORM image of the cells highlighted in the bright field image, corresponding to the red box in (B). (F–G) Polar plots of the orientations of microtubule filaments in the VAEM image (F) and STORM image (G) as highlighted in the red boxes in (D,E), respectively. The long axis of the cell is indicated by the purple axis in the polar plots. (H–K) Results of orientation analysis using the MFA software. The offset angle is 900 (long axis) and is not corrected in the polar plot, consistent with (F,G). Predominant angles are highlighted as green stars in the polar plot. Note that Figures (F,G) and Figures (H–K) are in different forms due to two different measuring methods. Scale bars: 30 μm (A) and 3 μm (B–I).

