
Fig. 5.
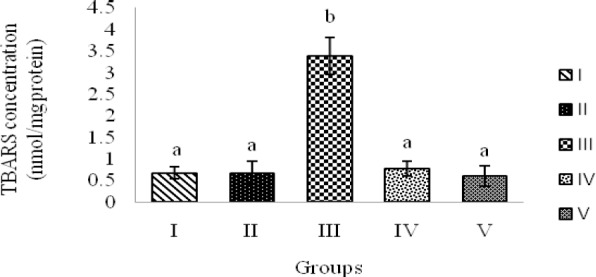
TBARS levels in hippocampal homogenate samples of rats demyelinated with ethidium bromide and treated with saffron extract. Groups: I; Control, no treatment, II; Sham, saline, III; EB, IV; EB + 5 μg saffron extract and V; EB + 10 μg saffron extract. Bars represent mean ± SEM (n=8, in each group). a and b indicate statistical differences between groups (P<0.01).