
Figure 3.
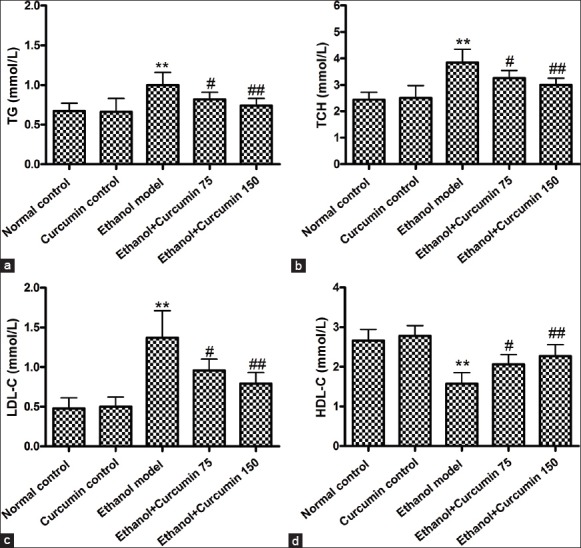
Effects of curcumin on ethanol-induced lipid disorders in mice. (a) Triglyceride contents; (b) total cholesterol levels; (c) low-density lipoprotein-cholesterol levels; (d) high-density lipoprotein-cholesterol levels **P < 0.01 versus normal control. #P < 0.05 and ##P < 0.01 versus ethanol model