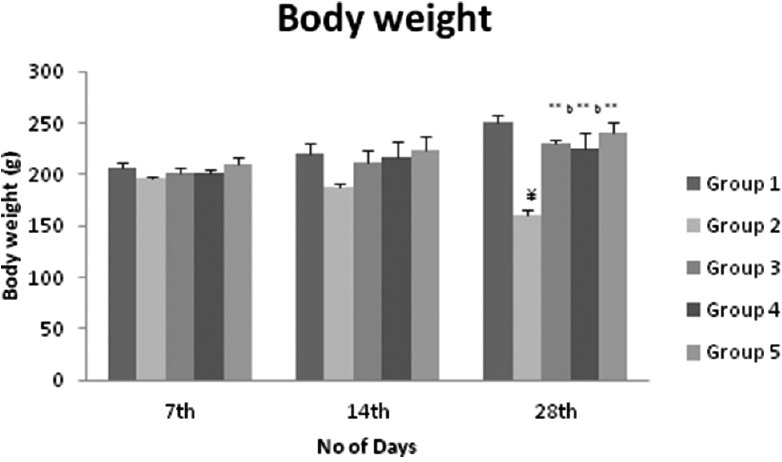
Figure 1.

Effect of formulation on body weight in streptozotocin induced diabetic rats statistical analysis was by a one-way ANOVA with Dunnett's multiple comparison test. Values are expressed as mean ± standard deviation and n = 6 for all groups. ***P < 0.0001, **P < 0.001, *P < 0.01 when group 3, 4, and 5 are compared with group 2 (diabetic control), a = 0.0001, b = 0.001, c = 0.05 when group 3 and 4 compared with group 5
