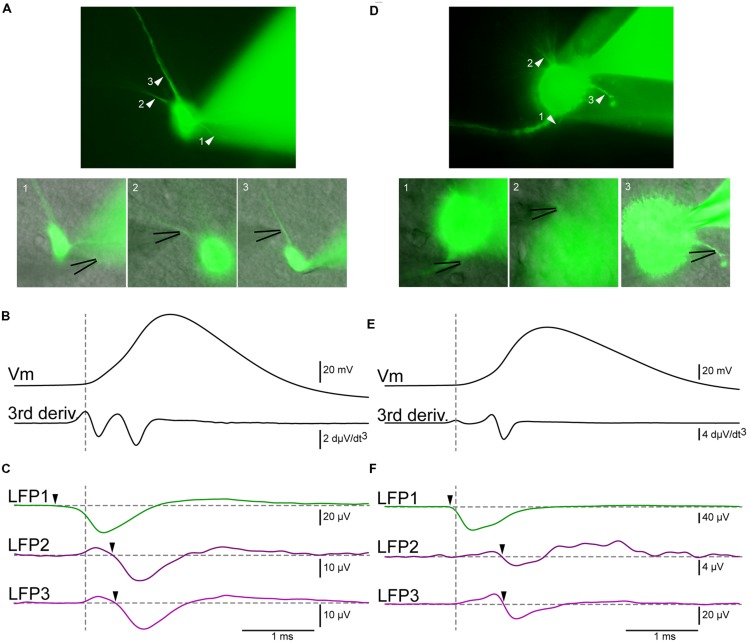
FIGURE 3.
LFP recordings allow the distinction of axon from dendrites. (A) Epifluorescent pictures of a pyramidal cell from the hippocampus. The black lines indicate the positions of the LFP electrodes (B) Upper trace: membrane potential recorded by a patch electrode located at the soma. Lower trace: third derivative of the membrane potential. The maximum of the first positive peak corresponds to the beginning of the action potential (vertical dashed line). (C) Green trace: average of the LFP obtained at position 1 (2095 sweeps). A negative event (arrowhead) started before the action potential, indicating that the electrode was positioned near the AIS. Upper purple trace: Average of the LFP obtained at position 2 (1002 sweeps). Lower purple trace: average of the LFP obtained at position 3 (1063 sweeps). In both cases the LFP consisted of a positive and then a negative deflection (arrowhead) occurring after the beginning of the spike, demonstrating that the electrode was located near an active dendrite. (D–F) Neuron from the midbrain. (D) Epifluorescent pictures of the neuron. (E) Membrane potential and third derivative of the membrane potential. (F) Green trace: Average of the LFP obtained at position 1 (1101 sweeps). A negative event started before the action potential (arrowhead), indicating that the electrode was positioned near the AIS. Upper purple trace: average of the LFP obtained at position 2 (1003 sweeps). Lower purple trace: average of the LFP obtained at position 3 (1188 sweeps). Here again, a negative deflection (arrowhead) occurring after the beginning of the spike shows that the electrode was located near an active dendrite.

