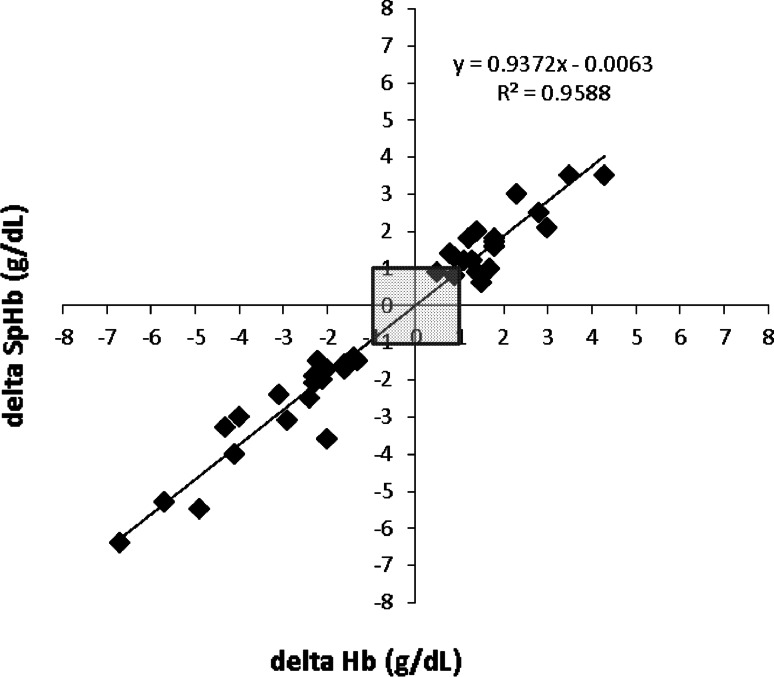
Fig. 4.
Regression plot of directional changes in consecutive SpHb values (delta SpHb, Y axis) compared to consecutive changes in Hb values (delta Hb, X axis), collected from 45 neurosurgery patients. Data points within the shaded area are below the clinically relevant threshold of changes of ≤1 g/dL

