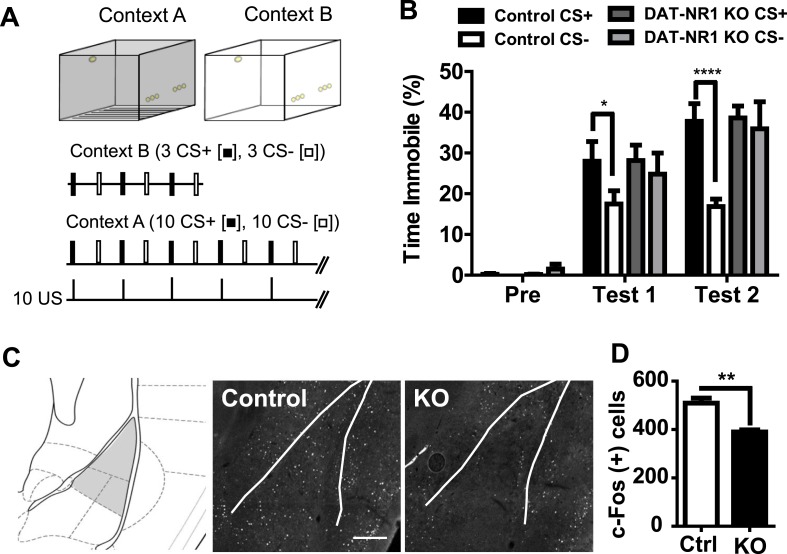
Figure 1. Impaired fear discrimination and c-Fos activation in the LA of DAT-NR1 KO mice.
(A) Fear conditioning paradigm. Mice were probed for freezing in context B (top right) to the CS+ and CS− with three presentations of each stimulus (middle) prior to fear conditioning (Pre) and 24 hr after each conditioning session (Test 1 and Test 2). Mice were conditioned in context A (top left) with 10 presentations of a CS− or CS + co-terminating with US delivery (bottom). (B) Freezing behavior (% Time Immobile) during presentation of the CS+ and CS− during pre-conditioning and Test 1 and Test 2. (C) Brain atlas image (left) (Paxinos and Franklin, 2013) illustrating LA subdivisions (gray shading) analyzed for c-Fos induction following fear conditioning. Representative c-Fos immunoreactive cells in the LA of control (control, left) and DAT-NR1KO (KO, right) mice following a single fear conditioning session. Scale bar = 250 μm (D) Average c-Fos positive cells in the LA of Ctrl and KO mice following fear conditioning (n = 3 mice each group, 8 sections/mouse). p < 0.01, unpaired Student's T-test.

