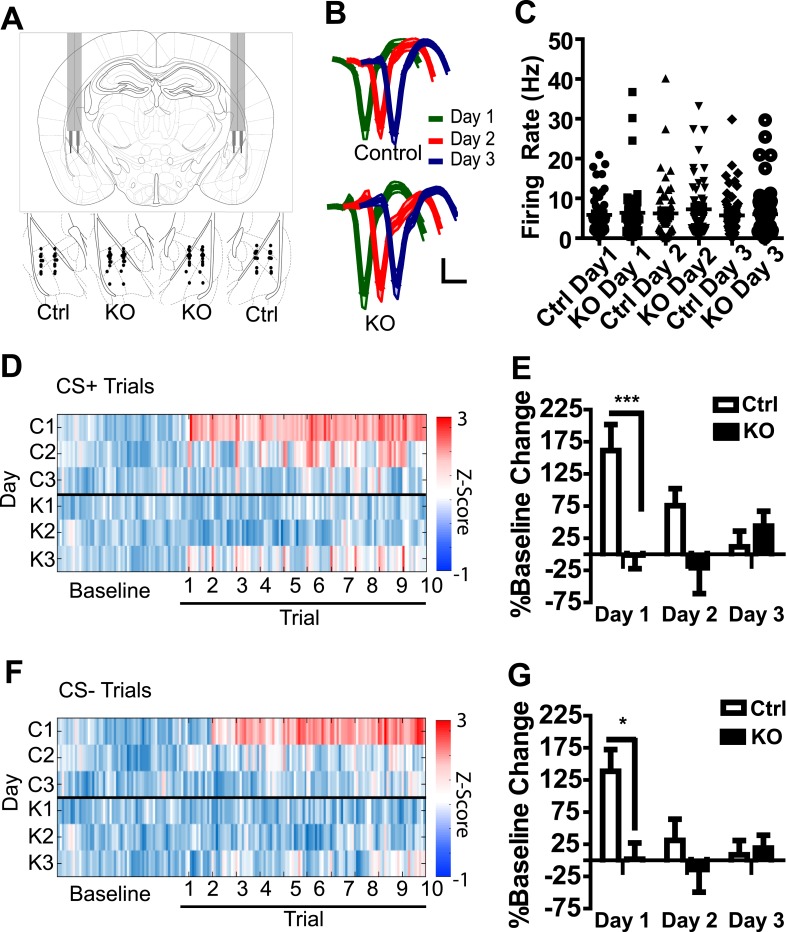
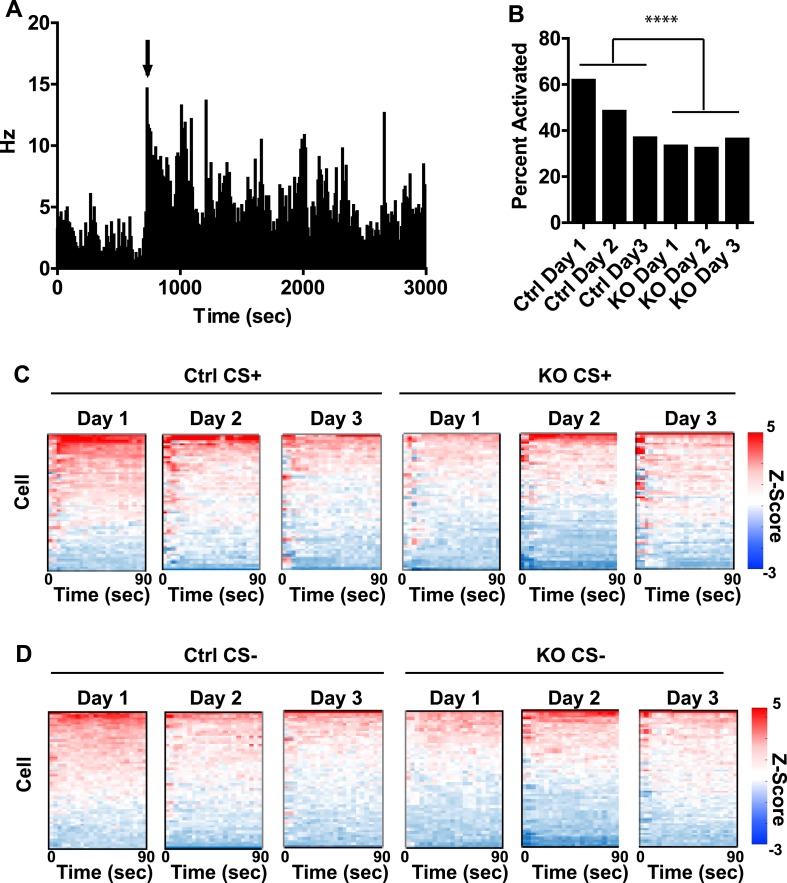
Figure 2. Population activity in the LA is not enhanced in DAT-NR1 KO mice following footshock.
(A) Brain atlas image (Paxinos and Franklin, 2013) illustrating bilateral tetrode implantation (top) and location of recording electrodes in Ctrl and KO mice. (B) Average waveform of recorded units in Ctrl and KO mice across days of conditioning. (C) Baseline firing rate of individual units in Ctrl and KO mice across days of conditioning (Control: n = 55, 52, and 54 Days 1–3, respectively; DAT-NR1 KO: n = 48, 57, and 58 Days 1–3, respectively). (D) Heat plot of normalized activity in concatenated CS + trials from Ctrl (top) and KO (bottom) mice. (E) Percent change from baseline activity during CS + trials following presentation of the US across days of conditioning. (F) Heat plot of normalized activity in concatenated CS− trials from Ctrl (top) and KO (bottom) mice. (G) Percent change from baseline activity during CS− trials following presentation of the US across days of conditioning. (E, G) Data are presented as the mean ± S.E.M. Repeated measures ANOVA, p < 0.001 and p < 0.05, Bonferroni post-test.


