. 2015 Sep 24;4:e08969. doi: 10.7554/eLife.08969

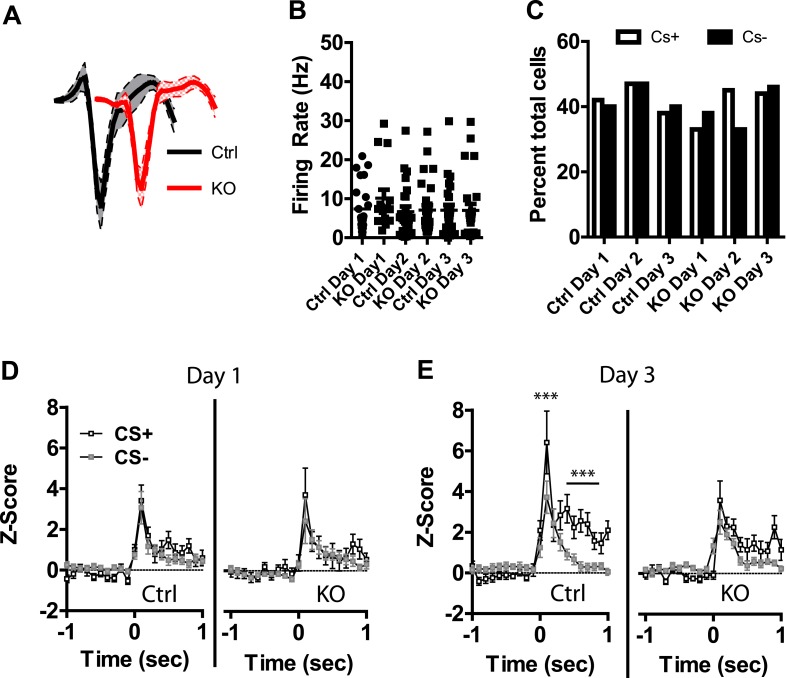
Figure 4. Plasticity in CS activated LA neurons is absent in DAT-NR1 KO mice.

(A) Average waveform of recorded units in Ctrl and KO mice that were activated by the CS+ and CS−. (B) Baseline firing rate of individual units in Ctrl and KO mice that were activated by the CS+ and CS− (Control: n = 21, 22, and 19 Days 1–3, respectively; DAT-NR1 KO: n = 14, 23, and 23 Days 1–3, respectively). (C) Proportion of neurons from Ctrl and KO mice that were activated by the CS+ and CS−. (D) Average normalized firing rate of CS+ and CS− activated neurons in Ctrl and KO mice on day 1 of conditioning. (E) Average normalized firing rate of CS+ and CS− activated neurons in Ctrl and KO mice on day 3 of conditioning. Data are presented as the mean ± S.E.M. Repeated measures ANOVA, p < 0.001 and p < 0.01, Bonferroni post-test.

DOI: http://dx.doi.org/10.7554/eLife.08969.008

Figure 4.

Figure 4—figure supplement 1. Plasticity in CS activated LA neurons is absent in DAT-NR1 KO mice.

Figure 4—figure supplement 1.

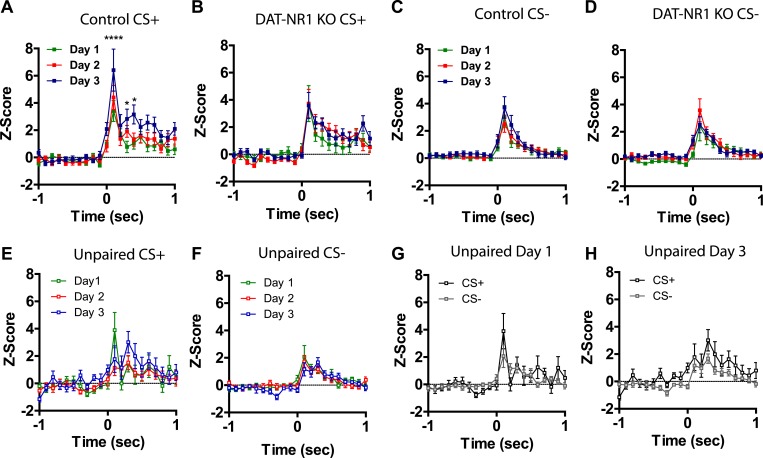
(A) Average normalized firing rate of CS + activated neurons in control mice across days of conditioning. (B) Average normalized firing rate of CS + activated neurons in in DAT-NR1 KO mice across days of conditioning. (C) Average normalized firing rate of CS− activated neurons in control mice across days of conditioning. (D) Average normalized firing rate of CS− activated neurons in in DAT-NR1 KO mice across days of conditioning. (E) Average normalized firing rate of activated neurons during presentation of unpaired CS+ in control mice across days of conditioning. (F) Average normalized firing rate of activated neurons during presentation of unpaired CS− in control mice across days of conditioning. (G) Average normalized firing rate of CS+ and CS− activated neurons in unpaired Ctrl mice on day 1 of conditioning. (H) Average normalized firing rate of CS+ and CS− activated neurons in unpaired Ctrl mice on day 3 of conditioning. Data are presented as the mean ± S.E.M. Repeated measures ANOVA, ****p < 0.0001, Bonferroni post-test.
Figure 4—figure supplement 2. CS activated LA neurons are not different at the start of conditioning.

Figure 4—figure supplement 2.

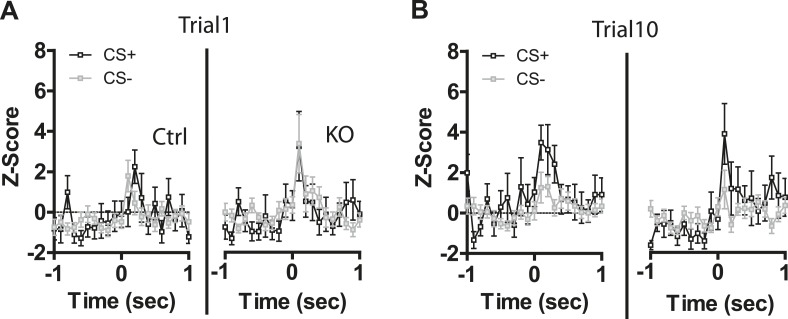
(A) Average normalized firing rate of CS+ and CS− activated neurons in Ctrl and KO mice during trial 1 of the first day of conditioning. (B) Average normalized firing rate of CS+ and CS− activated neurons in Ctrl and KO mice during trial 10 of the first day of conditioning.
Figure 4—figure supplement 3. Differential response latencies in CS activated neurons between control and DAT-NR1 KO mice.

Figure 4—figure supplement 3.

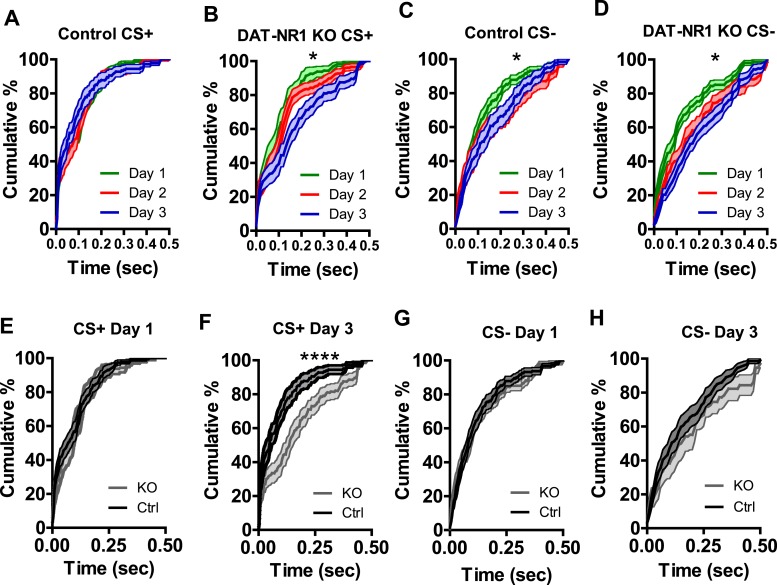
A) Average cumulative distribution of latency to increase activity in response to CS + presentation in control mice does not change across days. (B) Average cumulative distribution of latency to increase activity in response to CS + presentation in DAT-NR1 KO mice decrease across days. (C) Average cumulative distribution of latency to increase activity in response to CS− presentation in control mice decrease across days. (D) Average cumulative distribution of latency to increase activity in response to CS− presentation in DAT-NR1 KO mice decrease across days. (E) Average cumulative distribution of latency to increase activity in response to CS + presentation in control vs DAT-NR1 KO mice on day 1. (F) Average cumulative distribution of latency to increase activity in response to CS + presentation in control vs DAT-NR1 KO mice on day 3. (G) Average cumulative distribution of latency to increase activity in response to CS− presentation in control vs DAT-NR1 KO mice on day 1. (H) Average cumulative distribution of latency to increase activity in response to CS− presentation in control vs DAT-NR1 KO mice on day 3. Average normalized firing rate of CS+ and CS− activated neurons in unpaired Ctrl mice on day 3 of conditioning. Data are presented as the mean ± S.E.M. Repeated measures ANOVA, *p < 0.05, ****p < 0.0001, Bonferroni post-test.