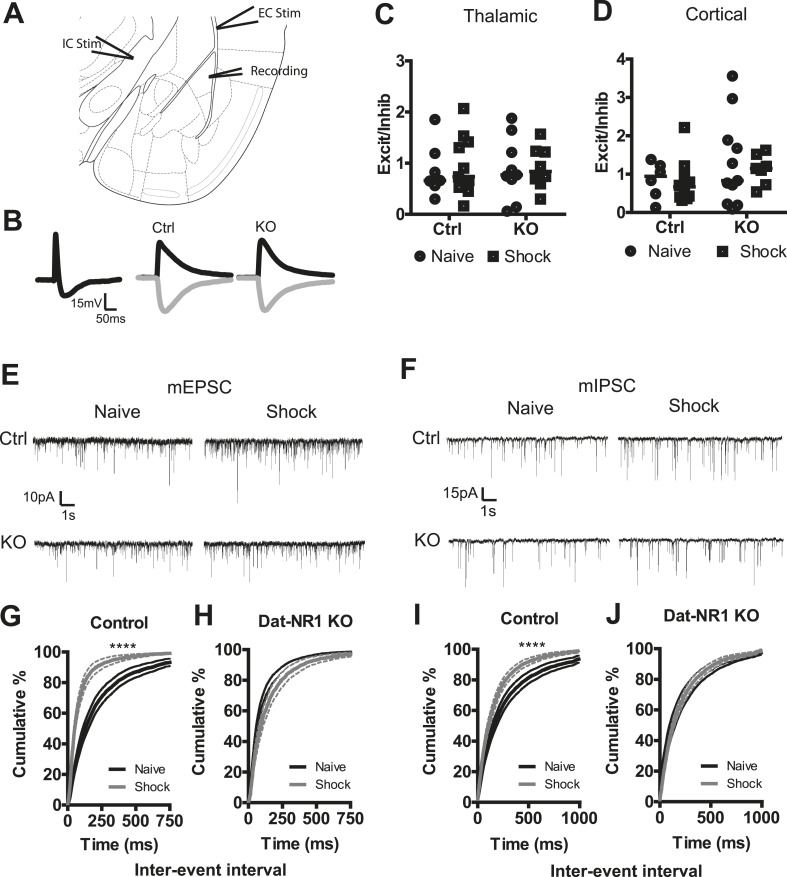
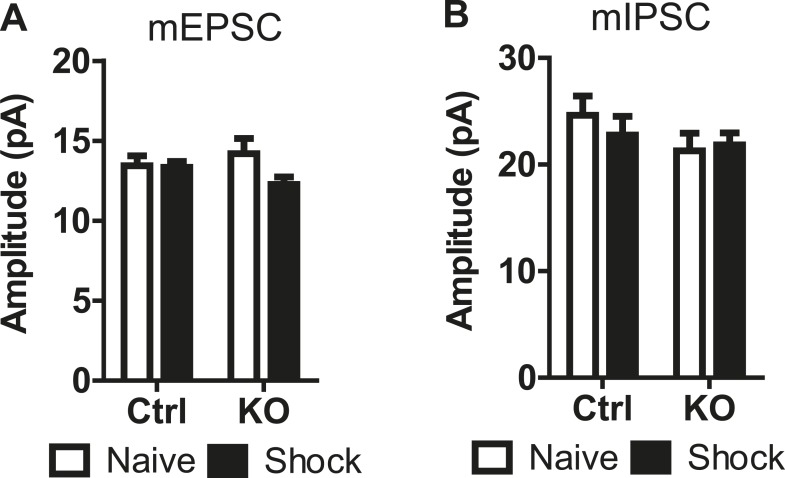
Figure 6. Synaptic plasticity in LA neurons is impaired in DAT-NR1 KO mice.
(A) Brain atlas image52 illustrating placement of stimulating electrodes in the IC and EC and recording electrode in the LA. (B) Representative compound PSP following thalamic stimulation (left) and isolated EPSP and IPSP from Ctrl (middle) and KO (right) mice. (C, D) Excitation/inhibition ratios of EPSP/IPSPs of individual neurons from Ctrl and KO mice following cortical (C, Control: n = 7 naïve, n = 8 shock; DAT-NR1: KO n = 9 naïve, n = 11 shock) and thalamic (D, Control: n = 6 naïve, n = 10 shock; DAT-NR1: KO n = 11 naïve, n = 7 shock) stimulations. (E, F) Representative mEPSCs (E) and mIPSCs (F) from naïve (black) and fear conditioned (gray) Ctrl and KO mice. (G, H) Cumulative distribution of mEPSC frequency from naïve and fear conditioned control (G, n = 18 naïve, n = 14 shock) and KO mice (H, n = 14 naïve, n = 13 shock). (I, J) Cumulative distribution of mIPSC frequency from naïve and fear conditioned control (I) and KO mice (J). Data are presented as the mean ± S.E.M. Repeated measures ANOVA, p < 0.0001, Bonferroni post-test.


