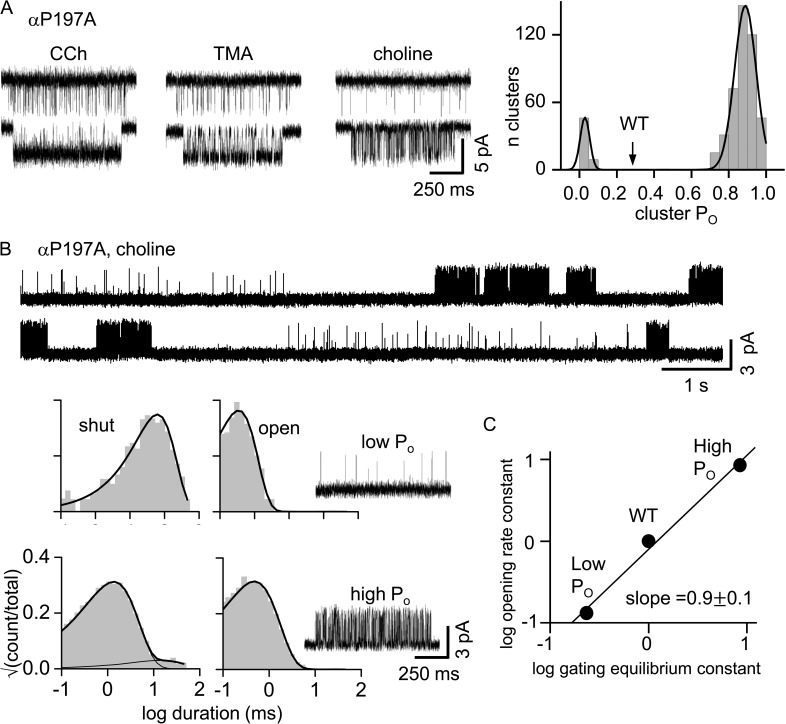
Figure 4.
Partial agonists generate fewer modes than does ACh. (A; left) Example clusters for αP197A adult AChRs ([agonist] = 1 mM; −100 mV; open is down). (Right) Cluster PO histogram for TMA with peaks at 0.04 ± 0.01 and 0.87 ± 0.10. Arrow, PO for TMA in WT AChRs (0.30 ± 0.06). The full agonist ACh has four PO populations (Fig. 2 B, bottom). (B) αP197A adult AChRs activated by a saturating [Cho] (100 mM; 70 mV; open is up). (Top) Two modes are apparent. (Bottom left) Interval duration histograms and example clusters of each mode. (C) Phi (slope) analysis of αP197A choline modes. The fold-change in the di-liganded gating equilibrium constant is caused mainly by a similar fold-change in the channel-opening rate constant.

