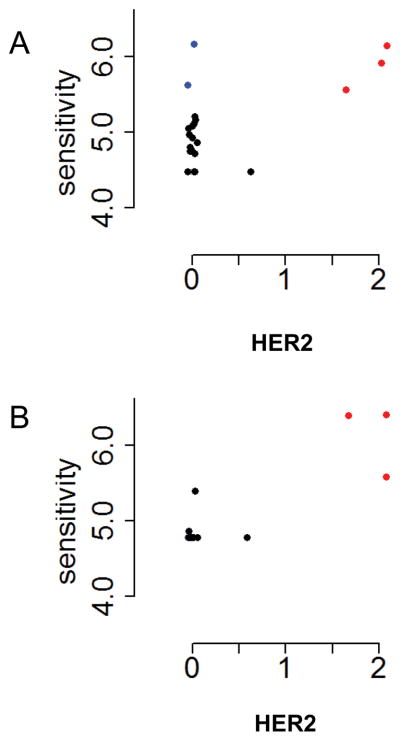
Figure 2.

Drug sensitivity as a function of HER2 expression. Each point corresponds to a cell line. A. Gefitinib B. Lapatinib. Sensitivity (vertical axis) is the negative common logarithm of GI50, the drug concentration that inhibits proliferation by 50% (ref. 4). The horizontal axis is the common logarithm of the spectral counts, after adding 1 to each value. Red symbols: cell lines that overexpress HER2. Blue symbols: drug-sensitive cell lines that do not overexpress HER2.
