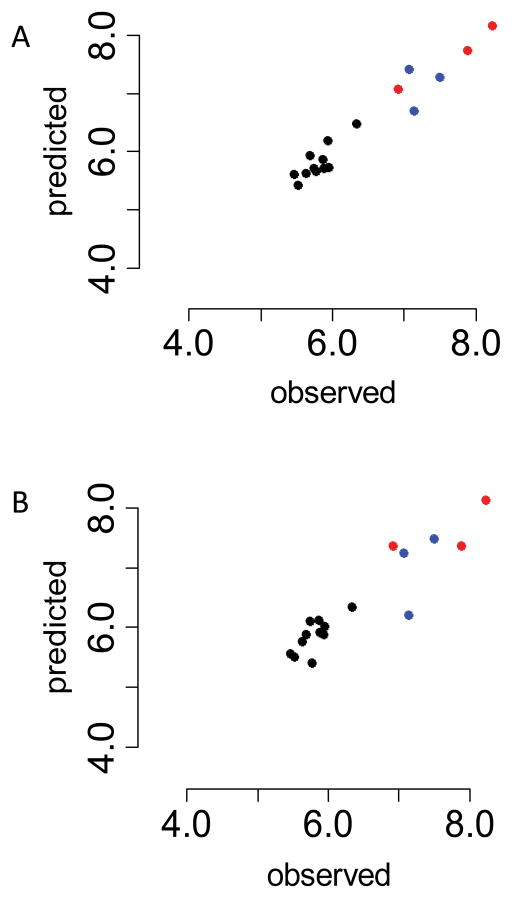
Figure 3.
Comparison of predicted with observed sensitivities for afatinib (BIBW2992). Observed values of the drug sensitivities are plotted on the horizontal axes. A. Fitted values from elastic net modeling are plotted on the vertical axis. The predictors are HER2, SLC7A5, BST2, LAMB1, CTSB, CDH13, TCN1, SUSD2 and A2ML1. B. Lasso model. The four predictor variables from the lasso model are HER2, SLC7A5, BST2 and A2ML1. The fitted values (vertical axis) were constructed with these predictors using ordinary least squares regression. Red symbols: cell lines that overexpress HER2. Blue symbols: drug-sensitive cell lines that do not overexpress HER2.

