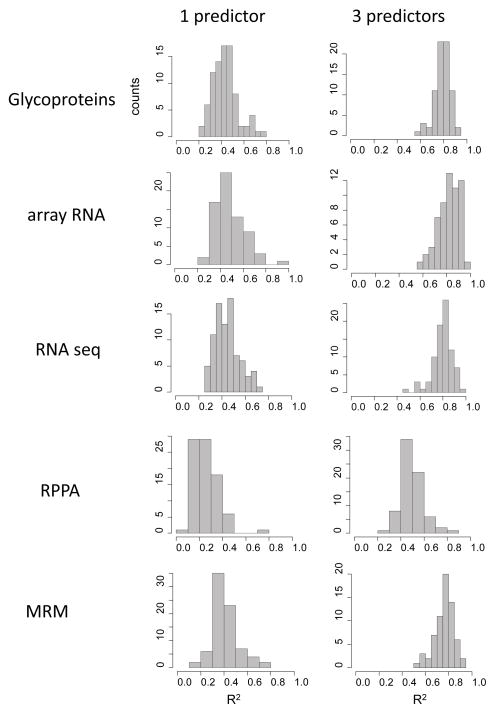
Figure 4.
Frequency distributions of coefficients of determination (R2) for all single predictor models and all three-predictor models. For each drug the pool of candidate predictors was identified by lasso regression (Supplementary Information Table 4). The best (lowest MSE) one and three predictor models were identified using the Leaps and Bounds algorithm [23]. The coefficients of determination were found using ordinary least squares regression.

