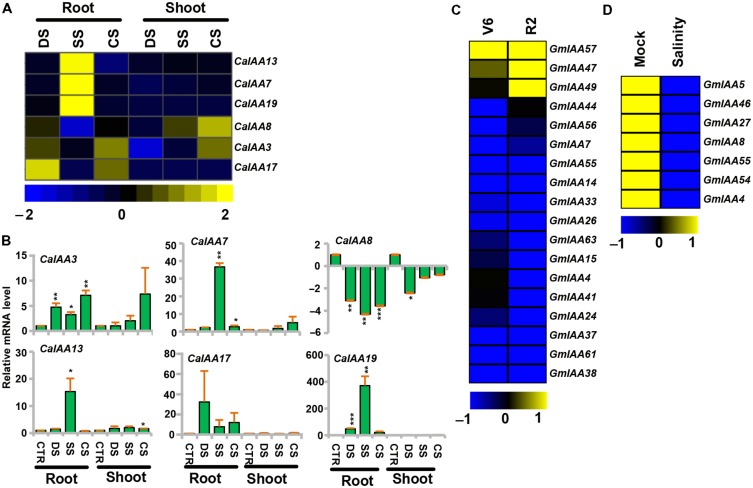
FIGURE 6.
Expression profiles of CaIAA and GmIAA genes under abiotic stress conditions. (A) Heatmap shows differential expression of CaIAA genes based on RNA-seq data. (B) qRT–PCR analysis of CaIAA genes under various stress treatments. Root and shoot control (CTR) was taken as a reference to determine relative mRNA level under stress conditions. Error bars indicate standard error of mean. Data points marked with asterisk (∗P ≤ 0.05, ∗∗P ≤ 0.01, and ∗∗∗P ≤ 0.001) indicate statistically significant difference between control and stress treatments. (C,D) Differential expression of GmIAA genes in response to drought and salinity stress conditions. Color scale shows log2 fold change relative to control sample. DS (desiccation), SS (salinity), CS (cold stress), V6 (vegetative stage leaves), R2 (reproductive stage leaves).

