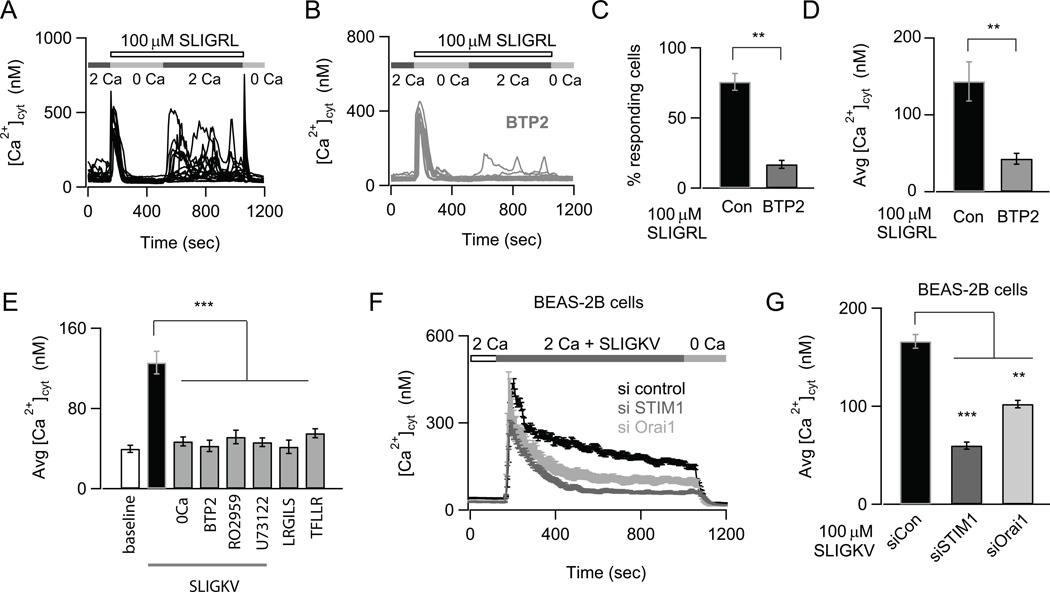
FIGURE 1.
Store-operated CRAC channels regulate Ca2+ signals induced by PAR2 activation. (A) The PAR2-agonist SLIGRL induces oscillatory Ca2+ signals due to SOCE. NHBE cells were treated with 100 µM SLIGRL in a nominally Ca2+ free solution to deplete internal stores. 2 mM Ca2+ was re-added to the external bath solution to activate SOCE. The Ca2+ traces show responses of individual cells in the imaging field. (B) Pre-treatment with the CRAC channel inhibitor BTP2 does not affect store-release but abrogates SOCE. Cells were treated with 500 nM BTP2 for 1.5 hours (A, B; data are mean ± SEM of N=18–21 cells; representative of 3 independent experiments). (C) Bar-graph summarizing the percentage of cells showing Ca2+ responses after re-addition of external Ca2+. (D) Summary of the amplitude of Ca2+ response at 840 sec (data are mean ± SEM of N=38–45 cells; 3 independent experiments). (E) Summary of the average elevation in [Ca2+]cyt in response to the PAR2 activating peptide SLIGKV in Ca2+ and nominally Ca2+ free solutions, control peptide LRGILS and PAR1 activating peptide TFLLR. The effects of CRAC channel inhibitor RO2959 and PLC inhibitor U73122 on SLIGKV mediated Ca2+ elevation is also indicated. The [Ca2+]cyt was measured 156–192 sec after addition of various peptides to NHBE cells with 2mM Ca2+ in the external bath (data are mean ± SEM of N=12–23 cells; 3 independent experiments). (F) Effects of siRNA knockdown of STIM1 and Orai1 on SLIGKV-induced Ca2+ signals in BEAS-2B cells (data are mean ± SEM of N=24–31 cells; representative of 3 independent experiments). The traces reflect the mean Ca2+ concentration of all cells in the imaging field. (G) Summary of mean [Ca2+]cyt levels 748 sec after addition of ligand. Statistical significance was determined by unpaired two-sample student t-test). The following standardized notation for statistical significance (P-values) is used in all the figures, * P< 0.05, ** P< 0.01, *** P< 0.001, n.s. (not significant).

