Figure 1.
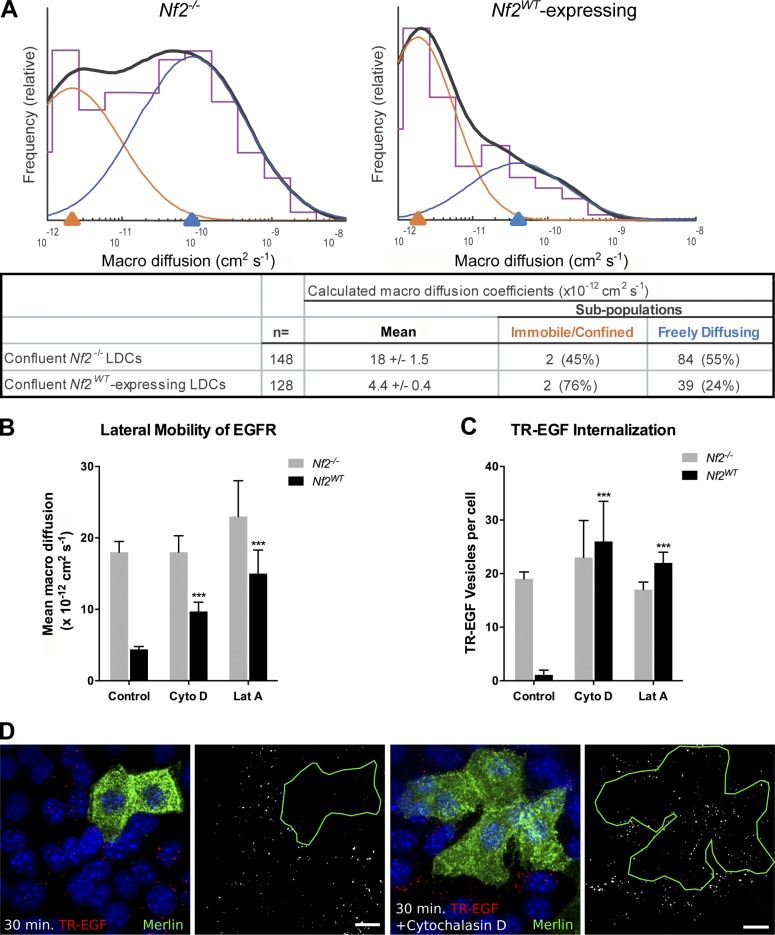
EGFR is immobilized at the plasma membrane in a Merlin- and actin-dependent manner. (A) SPTM depicting the mean diffusivity of EGFR molecules in the plasma membrane of Nf2−/− (left) or Nf2WT-expressing (right) LDCs. Histograms (purple) show the relative frequency at which beads were observed (y axis) with a given coefficient (Dmacro; x axis). Overlaid on each histogram is a two-Gaussian fit (orange and blue) and its sum (solid black). The log-scale x axis displays Dmacro representing increasing lateral diffusivity from left to right. The underlying chart displays the log mean of Dmacro ± SEM as well as the mean of the two-Gaussian fit subpopulations (right) and the percentage of receptors that fall into each subpopulation (parentheses). Subsequent figures show only the log mean of the Dmacro ± SEM for comparison. Numerical values of calculated Dmacro for all experiments are displayed in Table S1. (B) Lateral mobility of EGFR in Nf2−/− or Nf2WT-expressing LDCs with and without 5-µM cytochalasin D or 5-µM latrunculin A treatment. (C) Internalization of TR-EGF, which reliably marks EGF–EGFR complexes in Nf2−/− or Nf2WT-expressing LDCs with and without cytochalasin D or latrunculin A treatment. Numerical values for quantification of TR-EGF vesicles per cell for all experiments are displayed in Table S2. (D) Representative confocal images of internalized TR-EGF (red; 30-min stimulation) in mosaic populations of Nf2−/− and Nf2WT-expressing (green) LDCs with and without cytochalasin D. Bars, 10 µm. (B and C) Data are represented as mean ± SEM. ***, P < 0.001 (one-way ANOVA with multiple comparisons). Data are representative of at least three experiments.

