Figure 3.
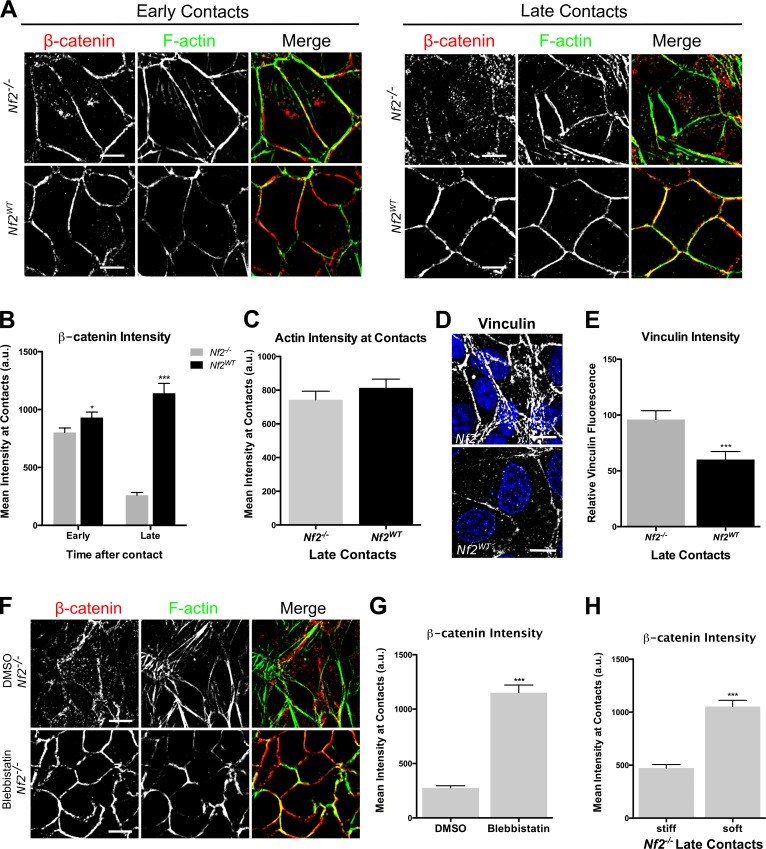
Cell junctions in Nf2−/− LDCs are under increased mechanical stress. (A) Confocal images showing Nf2−/− or Nf2WT-expressing LDCs at early (left) and late (right) stages of confluence; cells were labeled with an anti–β-catenin antibody (red) and with phalloidin to detect F-actin (green). (B) Junctional localization of β-catenin was quantified by fluorescence intensity analysis of AJs in early and late confluent Nf2−/− and Nf2WT-expressing LDCs. (C) Junctional localization of F-actin was quantified by fluorescence intensity analysis of AJs in late confluent Nf2−/− and Nf2WT-expressing LDCs. (D) Confocal images showing endogenous vinculin at AJs in Nf2−/− and Nf2WT-expressing LDCs. (E) The amount of vinculin at AJs in Nf2−/− and Nf2WT-expressing LDCs was quantified by measuring the junctional area stained for vinculin. (F) Confocal images showing endogenous β-catenin (red) and/or F-actin (green) in Nf2−/− LDCs treated with 100-µM blebbistatin or vehicle (DMSO). (G) Junctional localization of β-catenin in DMSO- and blebbistatin-treated confluent Nf2−/− LDCs was quantified by fluorescence intensity analysis of AJs. (H) Junctional localization of β-catenin in Nf2−/− LDCs cultured on stiff (40 kPa) and soft (12 kPa) polyacrylamide hydrogels. (B, C, E, G, and H) Error bars indicate SEM (n = 25 junctions per group). *, P < 0.05; ***, P < 0.001. Data are representative of at least three experiments. Bars, 10 µm. a.u., arbitrary units.

