Figure 4.
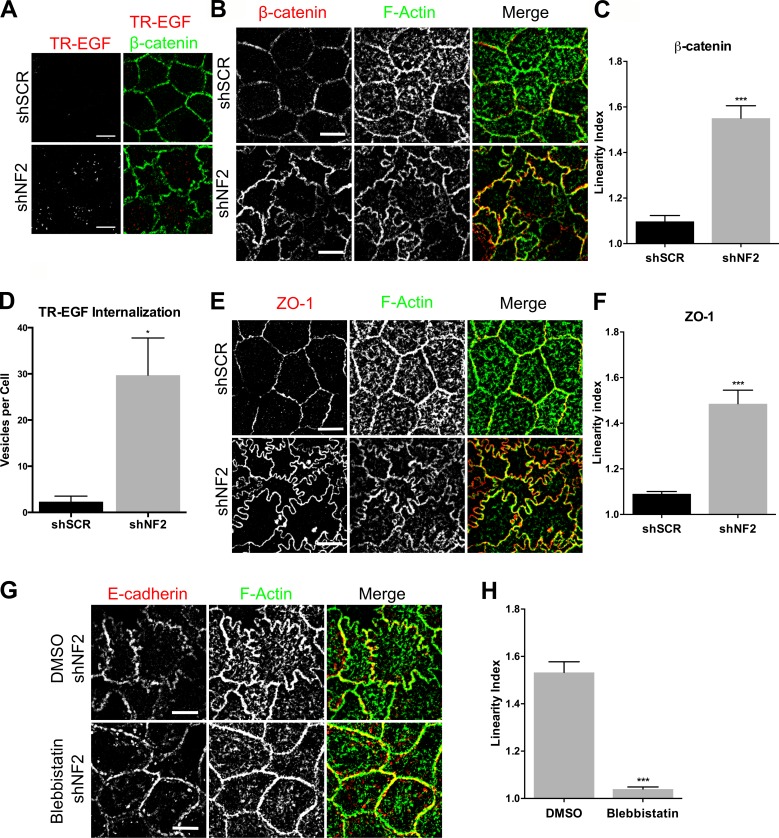
Merlin limits EGFR internalization and junctional stress in Caco2 colonic epithelial cells. (A) Confocal images of control (shSCR) and shNF2-expressing Caco2 cells showing the localization of β-catenin (green) and internalized TR-EGF (red; 30 min after stimulation). (B) Confocal images of control and shNF2-expressing Caco2 cells showing junctional localization of β-catenin (red) and F-actin (green). (C) Linearity index of β-catenin–labeled cell junctions in the experiment in B was quantified and graphed as the mean of the ratio of the length of a freehand-drawn line to a straight line drawn between two junctional vertices. (D) Internalized TR-EGF was quantified by fluorescence intensity thresholding to measure the number of TR-EGF vesicles per cell. (E) Confocal images showing junctional localization of ZO-1 (red) and F-actin (green). (F) Linearity index of ZO-1–labeled junctions calculated from the experiment in E. (G) Confocal images of shNF2-expressing Caco2 cells treated with 100-µM blebbistatin or DMSO showing junctional localization of E-cadherin (red) and F-actin (green). (H) Linearity index of F-actin–labeled junctions calculated from the experiment in F. (C, D, F, and H) Error bars indicate SEM. n = at least 25 junctions per group. *, P < 0.05; ***, P < 0.001. Data are representative of at least three experiments. Bars, 10 µm.

